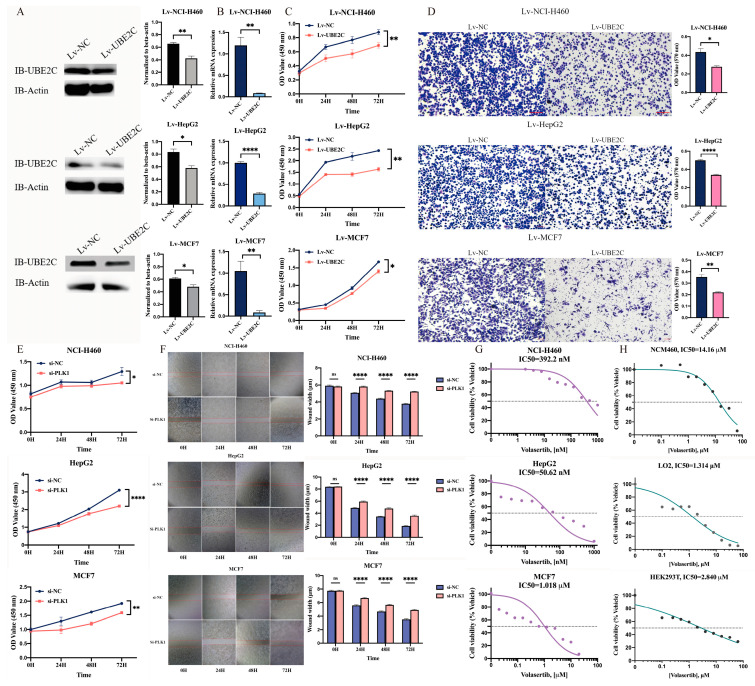
Figure 2.
Interfering with UBE2C and PLK1 could significantly inhibit the proliferation and migration of cancer cells. (A–D) After stable knockdown of Lv-NC and Lv-UBE2C, the expression levels of UBE2C protein (A) and UBE2C gene copy number (B) as well as the cell proliferation ability (C) and migration ability (D) of NCI-H460, HepG2, and MCF7 were tested. The microscopic images were captured at 10× magnification. (E,F) After si-NC and si-PLK1 knockdown, the cell proliferation ability (E) and migration ability (F) of NCI-H460, HepG2, and MCF7 were detected. The microscopic images were captured at 4× magnification. The bar graph on the right shows that at each time point, the treatment and the control group each take at least 9 pictures of the field of view for trace width statistics. ImageJ software (version 1.53) was used to calculate the average distribution of 8 straight lines in each image, and the values indicate mean ± SEM. (G) Cell viability assays were measured by CCK8 assay evaluating the response of PLK1 inhibitor. NCI-H460, HepG2, and MCF7 cancer cells (G) as well as the NCM460, LO2, and HEK293T normal cells (H) are treated with different doses of volasertib with at least three biological replicates in duplicates for 24 h. The graph presents normalization of transform X of dose vs. response. ns—No significance, *: p < 0.05; **: p < 0.01; ****: p < 0.0001 (two-sided unpaired Student’s t-test).

