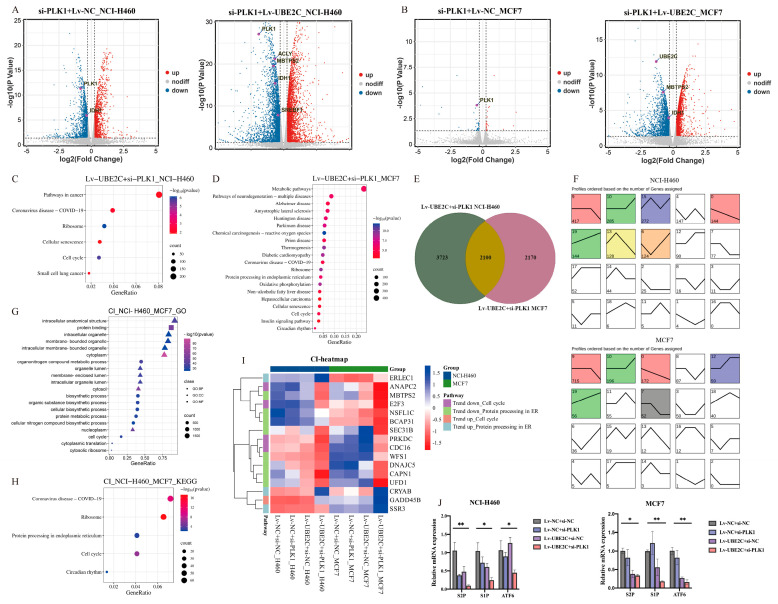
Figure 4.
Functional enrichment analysis of RNA-seq DEGs. (A,B) The volcano maps of NCI-H460 (left panel: Lv-NC+si-PLK1, right panel: Lv-UBE2C+si-PLK1) and MCF-7 (left panel: Lv-NC+si-PLK1, right panel: Lv-UBE2C+si-PLK1) DEGs with threshold of |FC| > 1.2 and FDR < 0.05. (C) and (D): The KEGG pathways of NCI-H460 and MCF7 Lv-UBE2C+si-PLK1 DEGs, respectively. (E) Lv-UBE2C+si-PLK1 overlapping DEGs of NCI-H460 and MCF7. (F) The trend analyzed by gene number of (J) overlapping DEGs (top panel: NCI-H460, bottom panel: MCF7). The upper left corner of each rectangle: profile number. The lower left quarter of each rectangle: gene number, representing the significance of enrichment. Trend line: the gene-fitting curve in each module, and each group is an inflection point. The order from left to right is Lv-NC+si-NC, Lv-NC+si-PLK1, Lv-UBE2C+si-NC, and Lv-UBE2C+si-PLK1, respectively. Profile color: the color profile is p < 0.05, indicating significant enrichment. The trend is similar, and the profiles have the same color. The white profiles represent the non-significance of this expression trend. (G,H): The GO and KEGG pathways of the overall upward- and downward-trending genes, respectively. (I) The heatmap of cell-cycle-related and protein processing in ER-related genes from both upward and downward trends. The color represents the TPM of different genes from RNA-seq groups of NCI-H460 and MCF-7 cancer cell lines. (J) Expression of S1P, S2P, and ATF6 transcripts in stable knockdown cell lines of NCI-H460 and MCF7. *: p < 0.05; **: p < 0.01 (Two-way ANOVA).

