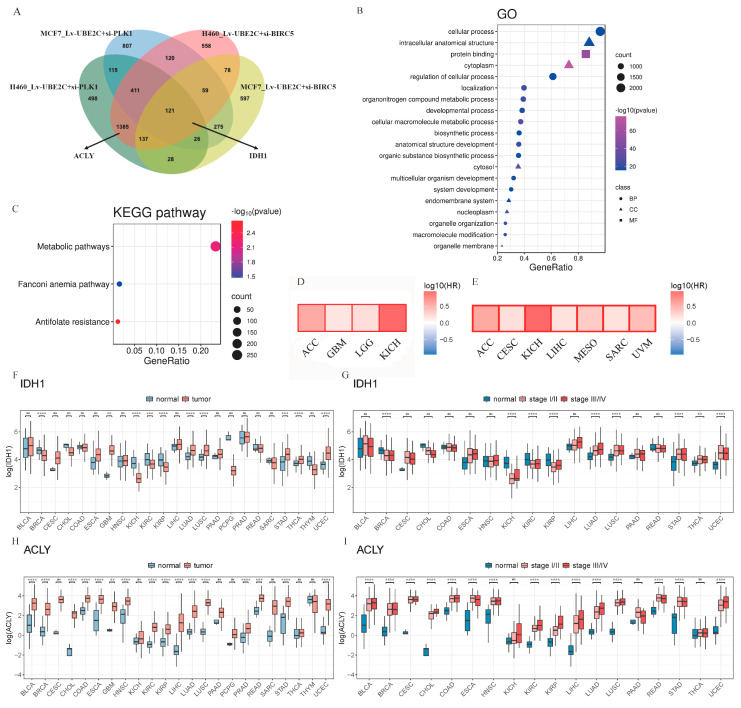
Figure 5.
Promising candidates, IDH1/ACLY, were discovered from the combination of RNA-seq analyses. (A) The overlap DEGs of four combined interference groups. (B,C), The GO and KEGG pathways of (A) two and more overlapping DEGs, respectively. (D) Kaplane–Meier estimates of overall survival (OS) are shown according to the expression level of IDH1. (E) Kaplane–Meier estimates of overall survival (OS) are shown according to the expression level of ACLY. (F) The expression levels of IDH1 in normal tissues and tumor samples. (G) The expression levels of IDH1 in pathological stages. (H) The expression levels of ACLY in normal tissues and tumor samples. (I) The expression levels of ACLY in pathological stages. ns—no significance; **: p < 0.01; ***: p < 0.001; ****: p < 0.0001, (two-sided unpaired Student’s t-test).

