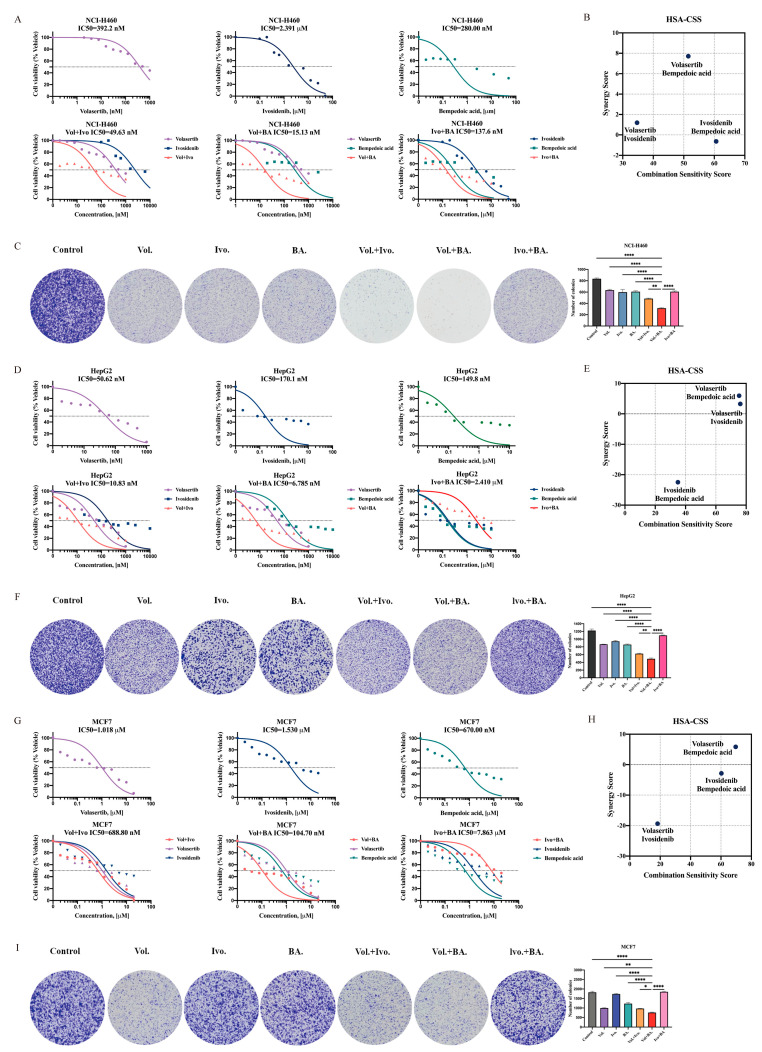
Figure 6.
PLK1 and ACLY inhibition imparts synergistic anti-proliferative response against pan-cancer cells. (A,D,G) Cell viability assays evaluating the response of PLK1, IDH1, and ACLY inhibitors. Percentages of live NCI-H460, HepG2, and MCF7 cells treated by different doses of PLK1 inhibitor volasertib and/or IDH1 inhibitor ivosidenib and/or ACLY inhibitor bempedoic acid are shown as the mean of at least three biological replicates in duplicates. The graph presented as the normalization of transform X of dose vs. response. (B,E,H) The highest single agent (HSA) model assesses the extent of drug–drug cell line synergies. The synergy scores or combination sensitivity scores (CSSs) shown in this plot are the summarized scores for whole combination matrix. (C,F,I) Representative images of colony formation assays. NCI-H460, HepG2, and MCF7 cells treated with volasertib and/or ivosidenib and/or bempedoic acid by corresponding 1/2 Vol+BA IC50 dose concentration followed by colony staining using crystal violet of at least three biological replicates in duplicate. The bar graph on the right represents the mean ± SEM in each group of samples. * p < 0.05, ** p < 0.01 and **** p < 0.0001 (ordinary one-way ANOVA). Vol: Volasertib; Ivo: Ivosidenib; BA: Bempedoic acid.

