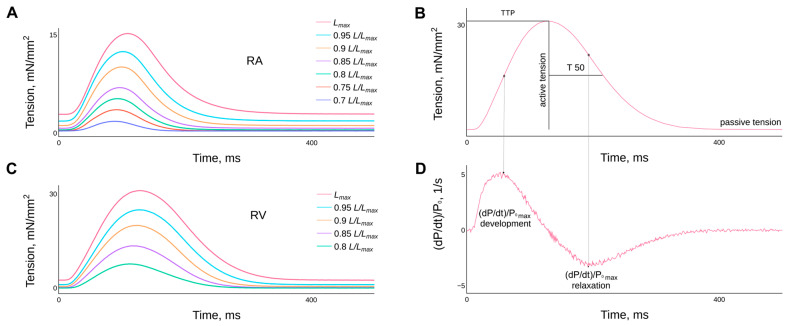
Figure 2.
Representative examples of the effect of length (or preload) on the time course of isometric tension in single contraction preparations of right atrial (A) and right ventricular (C) guinea pig myocardium. The lengths are presented as fractions of Lmax and are given in the legend. Panels (B,D) show the methodology used to determine the characteristics of isometric contraction, such as: the time to peak isometric tension (TTP); the time of tension relaxation from TTP to half the amplitude of active tension in the decay phase (T50); the normalised values of the maximum rates of tension development and relaxation. Temperature 30 °C, stimulation frequency 2 Hz.

