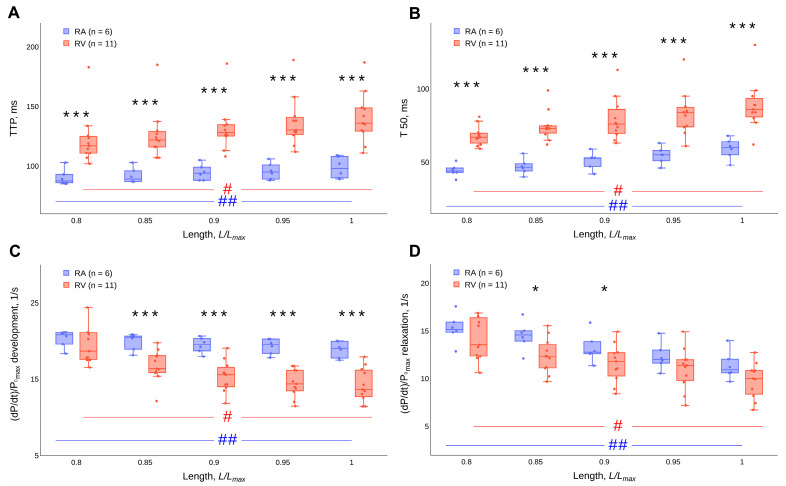
Figure 4.
Effect of the length of guinea pig atrial strips and ventricular trabeculae on (A) time to peak isometric tension (TTP), (B) time of tension relaxation from TTP to half the amplitude of active tension in the relaxation phase (T50), (C) the normalised values of maximal rates of tension development and (D) relaxation. Data are presented as box-whisker plots (box—IQR (Q1–Q3), Q2 inside the box, whisker—min and max, points—values (scatter plot)). * (p < 0.05) and *** (p < 0.001)—significant differences between RA and RV at the corresponding length (Mann–Whitney U-test). # and ##—significant differences between different lengths for RV and RA, respectively (p < 0.05, Friedman’s ANOVA).

