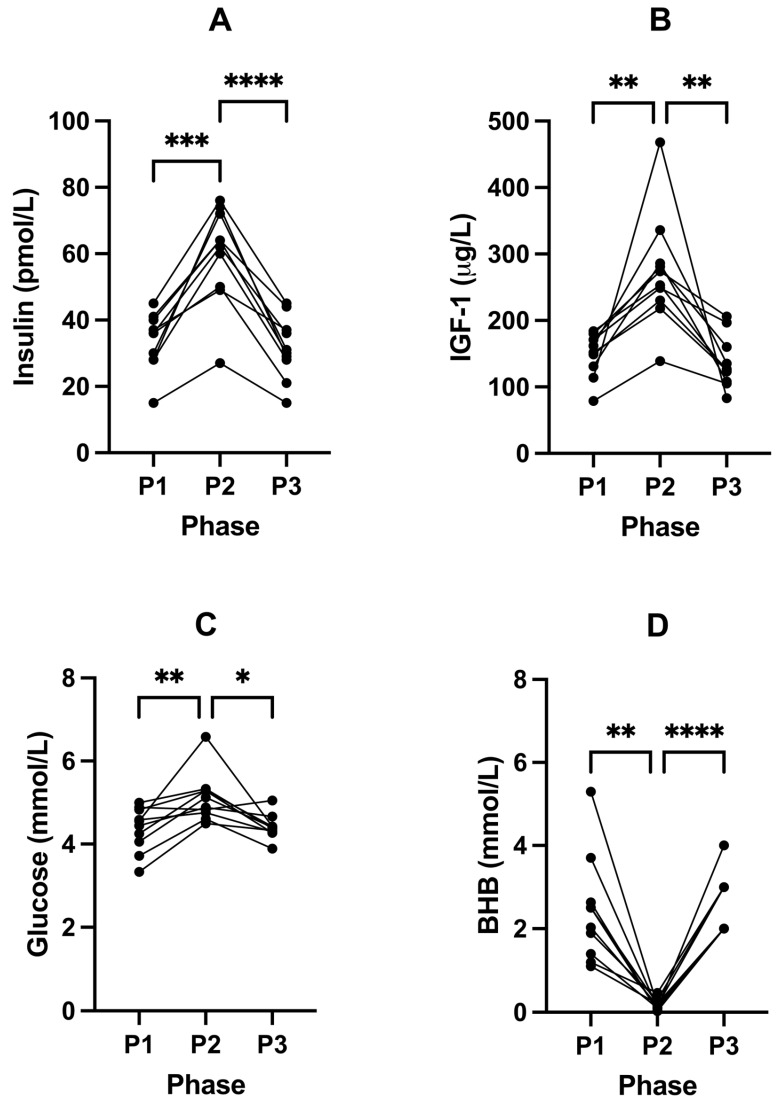
Figure 2.
Changes in fasted blood insulin (A), IGF-1 (B), glucose (C), and BHB (D) concentrations across all phases. Measurements were taken following each of the study phases: baseline nutritional ketosis (NK) P1; intervention to suppress ketosis (SuK) P2; and removal of SuK returning to NK, P3. Measurements were taken at 8 a.m. after a 12 h overnight fast; (n = 10). * p < 0.05; ** p < 0.01; *** p < 0.001; **** p < 0.0001.

