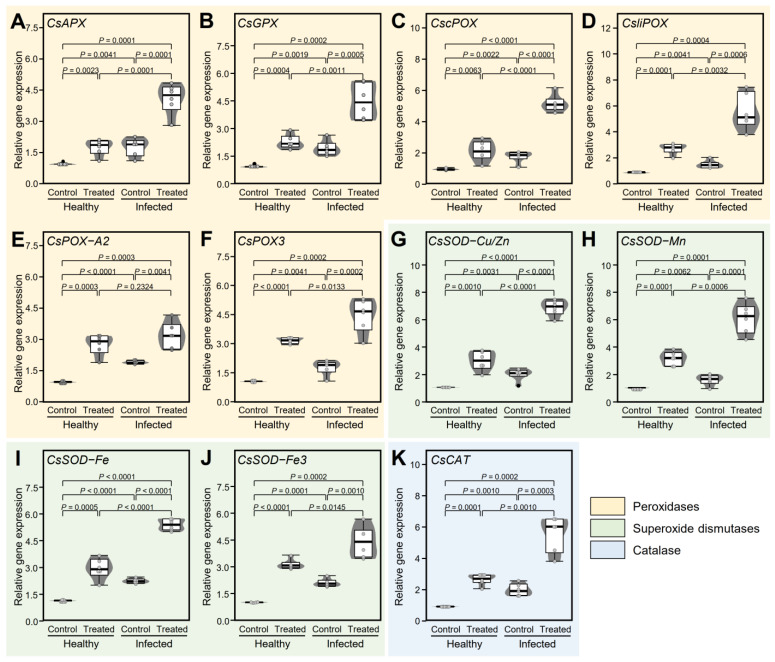
Figure 7.
Effect of γ-aminobutyric acid (GABA) supplementation on the relative gene expression of the antioxidant defense-related enzymes in the leaves of healthy and ‘Ca. L. asiaticus’-infected ‘Valencia’ sweet orange (C. sinensis) without GABA treatment (Control) or after the treatment with 10 mM GABA (treated) under greenhouse conditions. (A) Relative gene expression of L-ascorbate peroxidase, cytosolic isoform X1 (CsAPX), (B) phospholipid hydroperoxide glutathione peroxidase (CsGPX), (C) cationic peroxidase 1-like (CscPOX), (D) lignin-forming anionic peroxidase-like (CsliPOX), (E) peroxidase A2-like (CsPOX-A2), (F) peroxidase 3 (CsPOX3), (G) superoxide dismutase (Cu-Zn), chloroplastic (CsSOD-Cu/Zn), (H) superoxide dismutase (Mn), mitochondrial (CsSOD-Mn), (I) superoxide dismutase [Fe] 2, chloroplastic-like (CsSOD-Fe), (J) superoxide dismutase [Fe] 3, chloroplastic isoform X1 (CsSOD-Fe3), and (K) catalase-like isoform X1 (CsCAT). The minimum and the maximum values are presented by whiskers, while horizontal thick lines specify the median. Boxes show the interquartile ranges (25th to 75th percentile of the data), white dots represent the raw data (n = 6), and gray shades represent the corresponding violin plot. Presented p-values are based on a two-tailed t-test to statistically compare each pair of treatments. Statistical significance was established as αadjusted ≤ 0.0083 as calculated by Bonferroni Correction.

