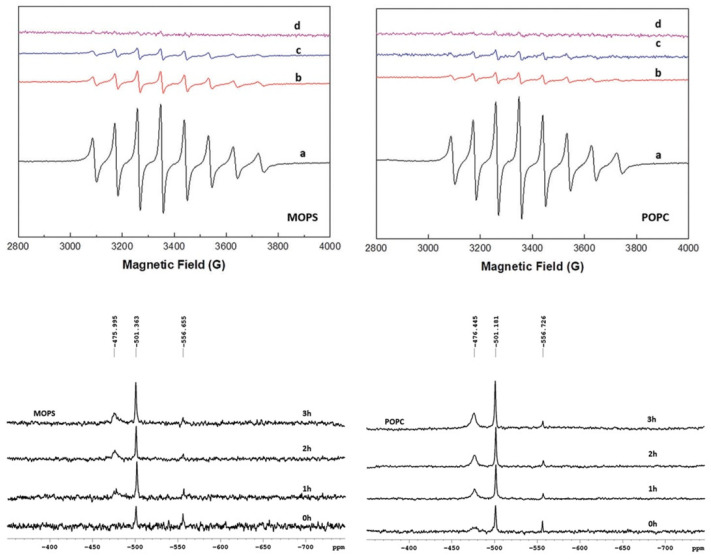
Figure 1.
EPR spectra of VO(dmpp)2 in buffer (MOPS) (upper panel, left) and in liposome suspension (POPC) (upper panel, right) at 0 h (a); 1 h (b); 2 h (c) 3 h (d); 51V NMR spectra of VO(dmpp)2 in MOPS (lower panel, left) and POPC (lower panel, right) at 0 h, 1 h, 2 h and 3 h. Adapted and reproduced from [21].

