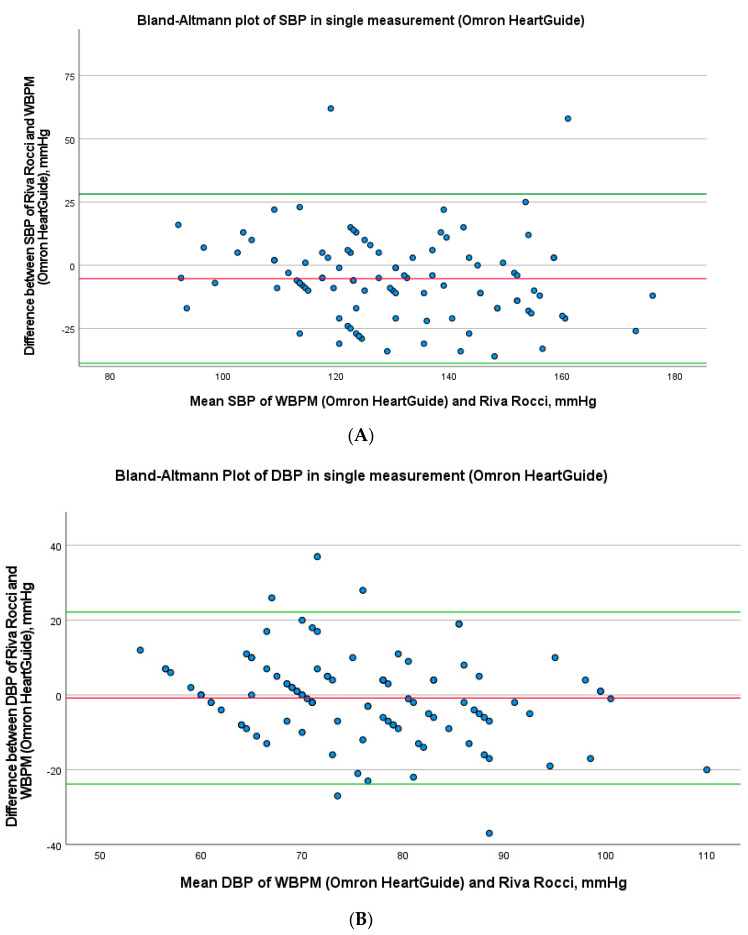
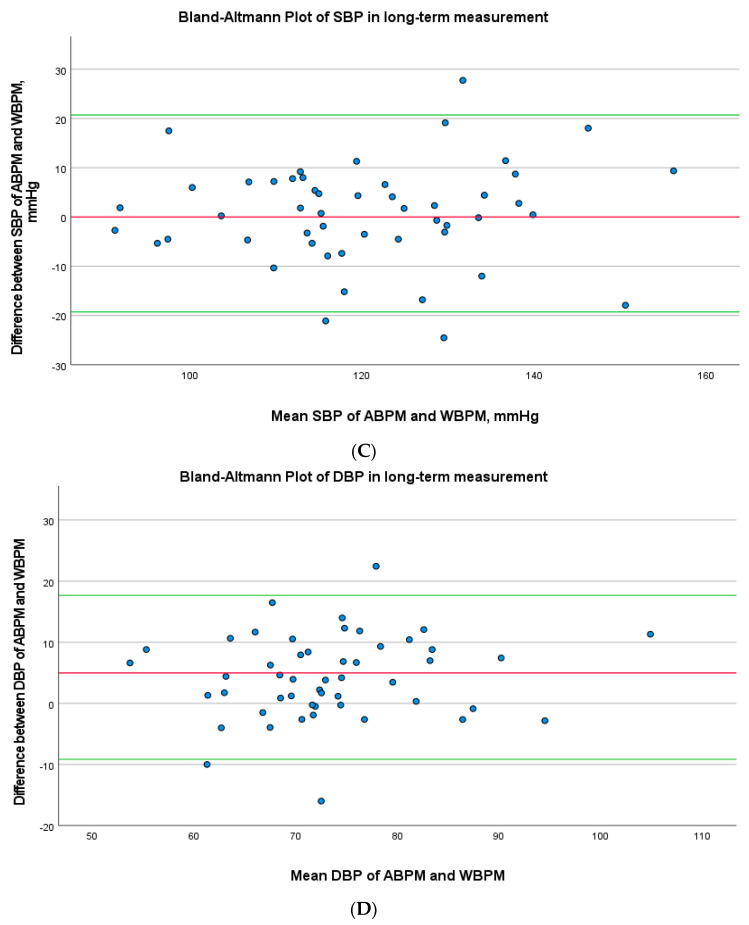
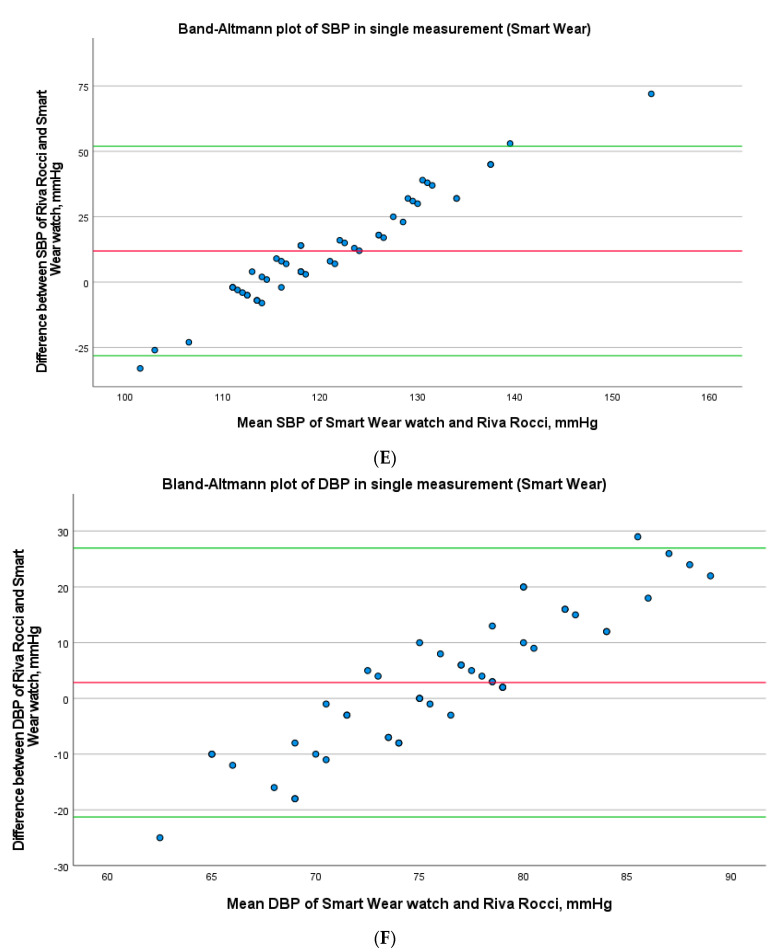
Figure 3.
(A) Bland–Altman Plot of SBP in single measurement (Omron HeartGuide). Bland–Altman plots for the SBP differences between Riva-Rocci and readings of the WBPM in the single measurement. Thick red solid line = mean difference; green line = ±1.96 standard deviations of the mean difference. Abbreviations: WBPM, wearable blood pressure monitoring; SBP, systolic blood pressure. (B) Bland–Altman plot of DBP in single measurement (Omron HeartGuide). Bland–Altman plots for the DBP differences between Riva-Rocci and readings of the WBPM in the single measurement. Thick red solid line = mean difference; green line = ±1.96 standard deviations of the mean difference. Abbreviations: WBPM, wearable blood pressure monitoring; DBP, diastolic blood pressure. (C) Bland–Altman Plot of SBP in long-term measurement. Bland–Altman plots for the SBP differences between ABPM and readings of the WBPM in the long-term measurement. Thick red solid line = mean difference; green line = ±1.96 standard deviations of the mean difference. Abbreviations: WBPM, wearable blood pressure monitoring; ABPM, ambulatory blood pressure monitoring; SBP, systolic blood pressure. (D) Bland–Altman plot of DBP in long-term measurement. Bland–Altman plots for the DBP differences between ABPM and readings of the WBPM in the long-term measurement. Thick red solid line = mean difference; green line = ±1.96 standard deviations of the mean difference. Abbreviations: WBPM, wearable blood pressure monitoring; ABPM, ambulatory blood pressure monitoring; DBP, diastolic blood pressure. (E) Bland–Altman Plot of SBP in single measurement (Smart Wear watch). Bland–Altman plots for the SBP differences between Riva-Rocci and readings of the Smart Wear watch in the single measurement. Thick red solid line = mean difference; green line = ±1.96 standard deviations of the mean difference. Abbreviations: SBP, systolic blood pressure. (F) Bland–Altman Plot of DBP in single measurement (Smart Wear watch). Bland–Altman plots for the DBP differences between Riva-Rocci and readings of the Smart Wear watch in the single measurement. Thick red solid line = mean difference; green line = ±1.96 standard deviations of the mean difference. Abbreviations: DBP, diastolic blood pressure.


