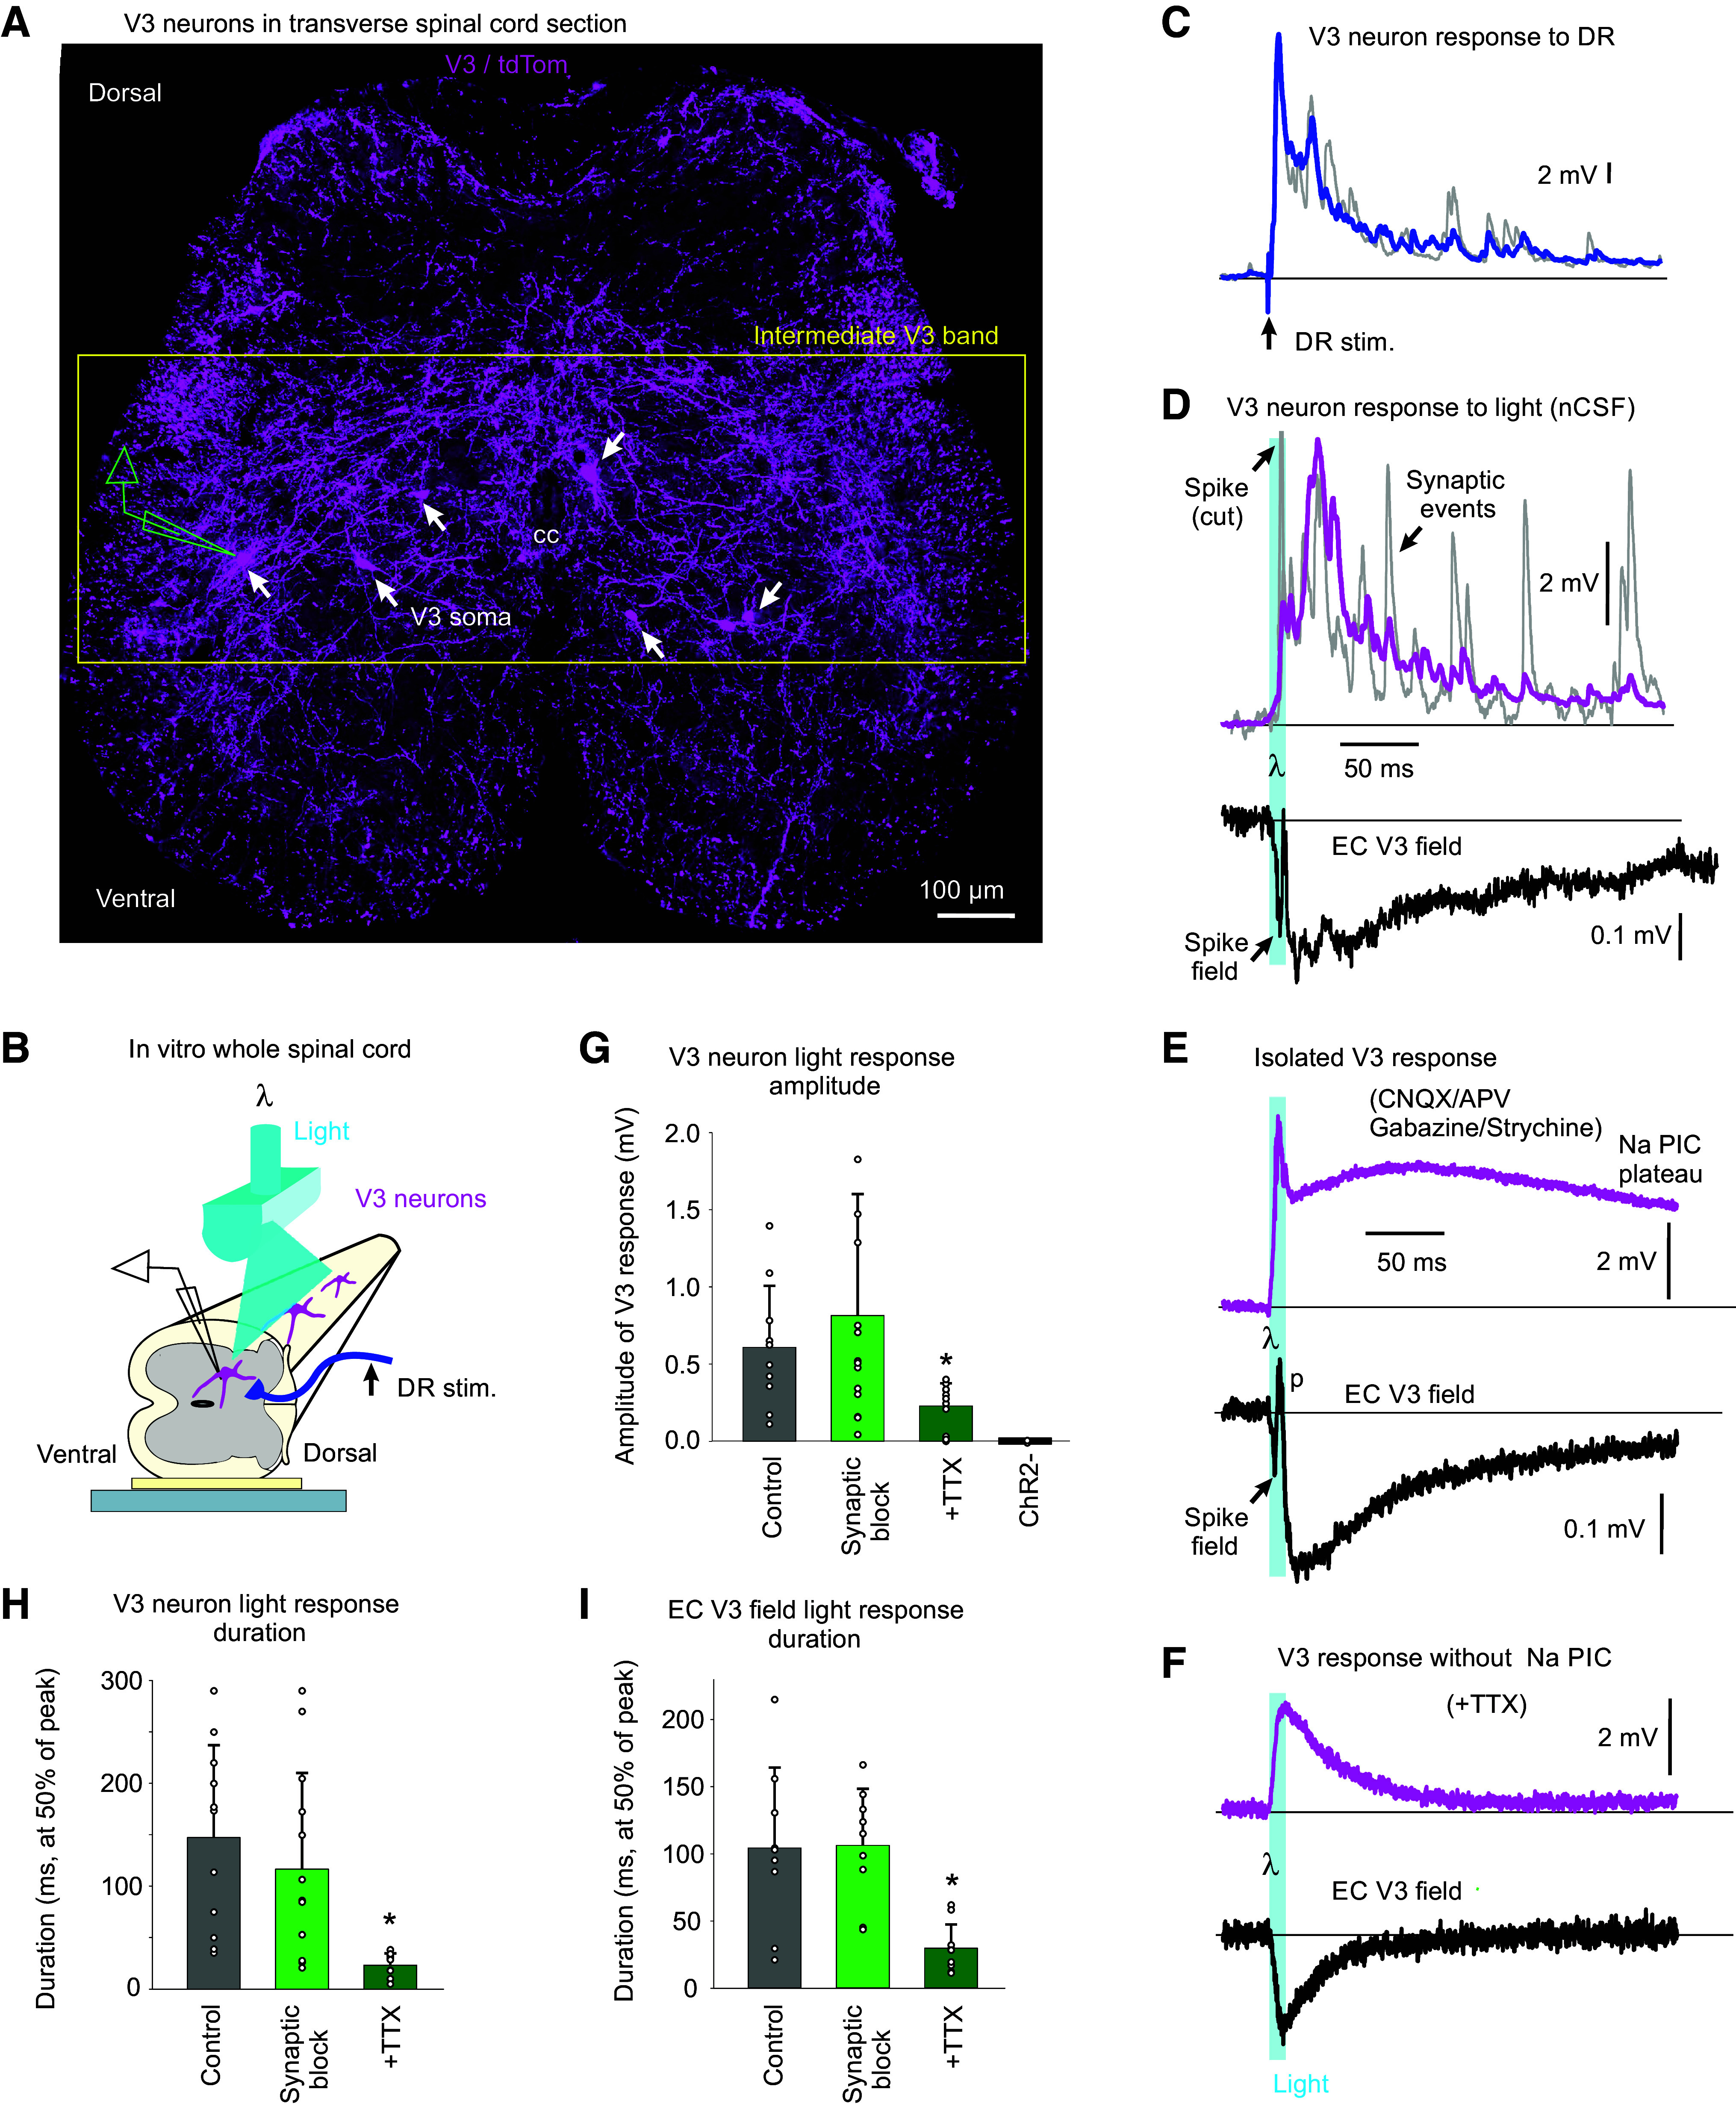
Figure 4.

Long-lasting response evoked in V3 neurons by brief activation, mediated by persistent sodium currents. A: transverse section of sacral S3 spinal cord of Sim1//tdTom mice showing V3 neurons with their extensive arborizations throughout much of the intermediate lamina, where we recorded from V3 neurons intracellularly, as depicted. Image reproduced from Fig. 7A. where details are given. B: arrangement for intracellular or extracellular recording from V3 neurons in Sim1//ChR2 mice, with neurons identified by a direct response to a light pulse (10 ms pulse, λ = 447 nm laser, 0.7 mW/mm2, 3xT, T light threshold to evoke response, laser columnated and aligned axially along multiple segments), with no synaptic delay. C: long-lasting V3 neuron EPSP in response to DR stimulation (0.1 ms, 2xT; as in Fig. 1D), with blue line average of 10 trials (at 0.3 Hz), and gray line individual trial showing many synaptic events. D: long-lasting V3 neuron response to the light pulse (10 ms, 1.5xT), with magenta line average of 10 trials, and gray line individual trial showing many fast synaptic events superimposed, as well as a fast spike at the onset of the response. Lower black line is the extracellular recording (EC field, averages of 10 trials) of the population response of V3 neurons to the same light pulse, which also showed a fast spike. E: same as D, but after blocking synaptic transmission (with 50 µM CNQX, 50 µM APV, 50 µM gabazine, and 5 µM strychnine), showing a long-lasting V3 neuron depolarization (plateau potential) from voltage-gated currents intrinsic to the V3 neurons. F: same as E, but after also blocking sodium channels with TTX (2–3 µM), which eliminated the long-lasting response (and fast spike), showing that the plateau potential in E was due to persistent sodium currents (Na PICs). G–I: group averages of V3 neuron responses to the brief light pulse, with amplitudes (quantified at 60 ms latency) and durations shown in control conditions, after blocking synaptic transmission, and then after also applying TTX. Lack of light response in Sim1//ChR2- mice also shown. Duration measured at 50% peak amplitude. *Significant reduction with TTX but not synaptic blockade, P < 0.05, n = 11 intracellular V3 recordings from 5 mice, and n = 16 EC V3 fields from 5 mice. D–F on same time scale. DR, dorsal root; EC, extracellular.
