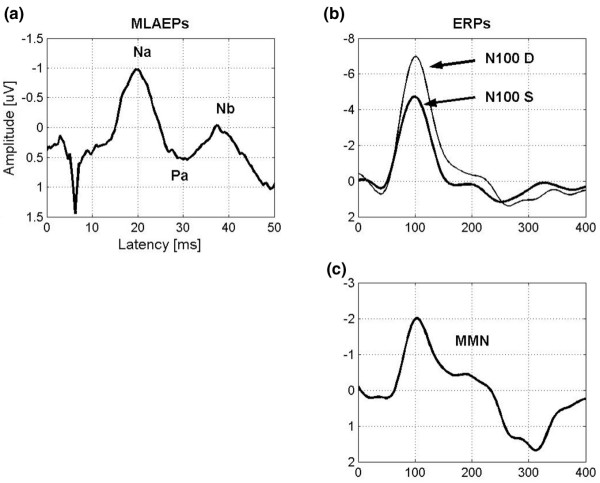
Figure 1.

(a) The middle-latency auditory evoked potential (MLAEP) components Na, Pa, and Nb appear 10–50 ms after the onset of auditory stimulus. (b) N100 is the most prominent event-related potential (ERP) component. The thick line is the N100 for standard stimuli (N100 S) and the thin line is the N100 for deviant stimuli (N100 D). (c) The mismatch negativity (MMN) curve is obtained as a difference curve N100 D–N100 S. The MMN is the negative area under the curve between 100 and 250 ms.
