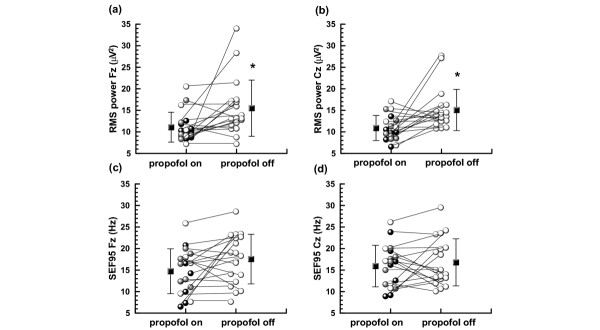
Figure 2.

Average and individual root mean squared (RMS) power and spectral edge frequency 95% (SEF95) values during and after discontinuation of propofol infusion in the (a, c) frontal (Fz) and (b, d) central (Cz) regions. Lines connect values obtained from the same patient; black squares with vertical lines indicate the mean ± standard deviation. Individual sedation levels obtained with the Sedation–Agitation Scale (SAS): white spheres: SAS 4, gray spheres: SAS 3, black spheres: SAS2. *Significantly different from 'propofol on'.
