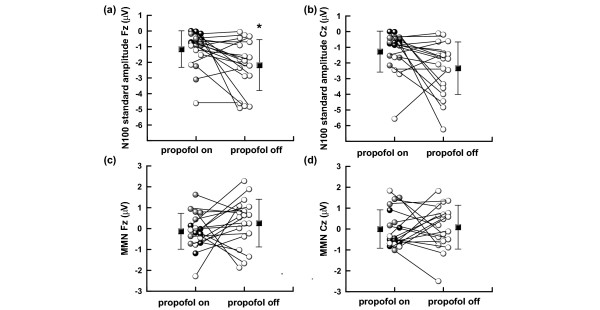
Figure 3.

Average and individual N100 standard amplitude and mismatch negativity (MMN) values during and after discontinuation of propofol infusion in the (a, c) frontal (Fz) and (b, d) central (Cz) regions. Lines connect values obtained from the same patient; black squares with vertical lines indicate the mean ± standard deviation. Individual sedation levels obtained with the Sedation–Agitation Scale (SAS): white spheres: SAS 4, gray spheres: SAS 3, black spheres: SAS2. *Significantly different from 'propofol on'.
