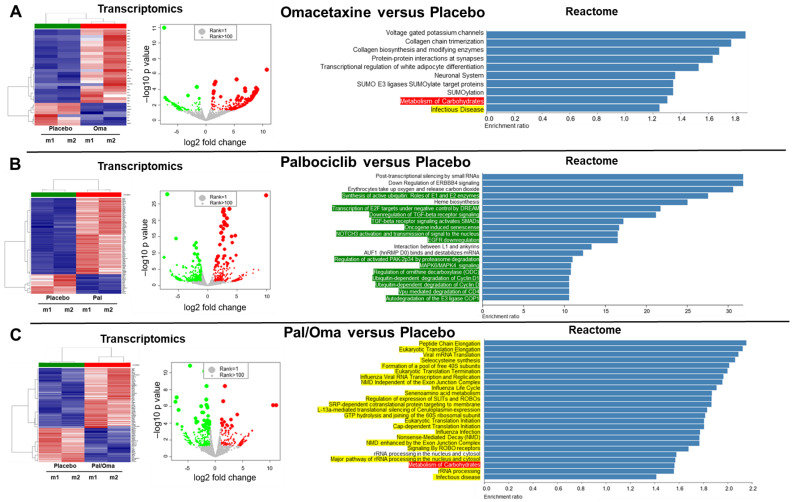
Figure 4.
RNA-Seq analyses of Parsortix-harvested CTC-enriched cell populations in four different mouse groups. Mouse blood from each experimental group was collected, pooled, and analyzed using Parsortix. Cellular fractions enriched with CTCs were harvested, followed by RNA isolation and transcriptomic profiling. Hierarchical clustering of gene expression profiling showed differential clustering of CTCs from placebo mice versus CTCs from omacetaxine-treated mice (A), CTCs from placebo mice versus CTCs from palbociclib-treated mice (B), or CTCs from placebo mice versus CTCs from mice receiving combinatory drug treatment (C). Corresponding heat maps are shown (left panels, red = upregulated, blue = downregulated). Scatter plots display global gene ex-pression of CTC populations with significant log2 fold change in the placebo group (green dots) versus the drug-treated groups (red dots; middle panels). Right panels show statistically significant pathways resulting from the hierarchical clustering using Reactome analysis. Pathways highlighted in red are the molecular pathways related to metabolic profiling. Highlighted in yellow are the pathways containing the CTC RPL/RPS gene signature of MBM [28]. Molecular pathways associated with proliferation are highlighted in green. See “Materials and Methods” for experimental details.

