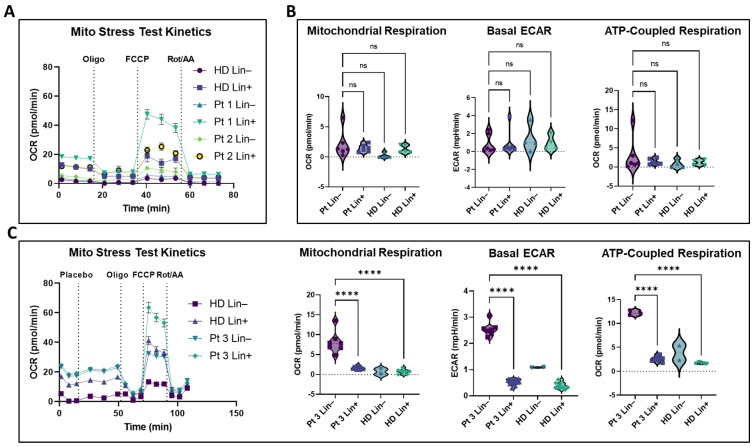
Figure 6.
Metabolic flux in patient-derived Lin−/CTC fractions. (A) Representative Mito Stress Test kinetics after lineage separation of two patients and a healthy donor sample. (B) Pooled metabolic parameters for the entire patient dataset. (C) OCR kinetics and metabolic parameters of Patient 1, showing basal respiration, basal ECAR, and ATP-coupled respiration to be elevated in the patient Lin−/CTC fraction. Violin plots all represent normalized data. All analysis was performed using two-way ANOVA with Kruskal–Wallis multiple comparisons test. OCR parameters at or below background threshold that showed appropriate well kinetics were treated as “0” values. Basal ECAR from Mito Stress Tests represent per-well averages of the three ECAR reads preceding the first drug injection. Analyzed patient samples all displayed robust flux kinetics and all experiments included control healthy donor cells on the same Seahorse plate. ns = non-significant, **** p < 0.0001.

