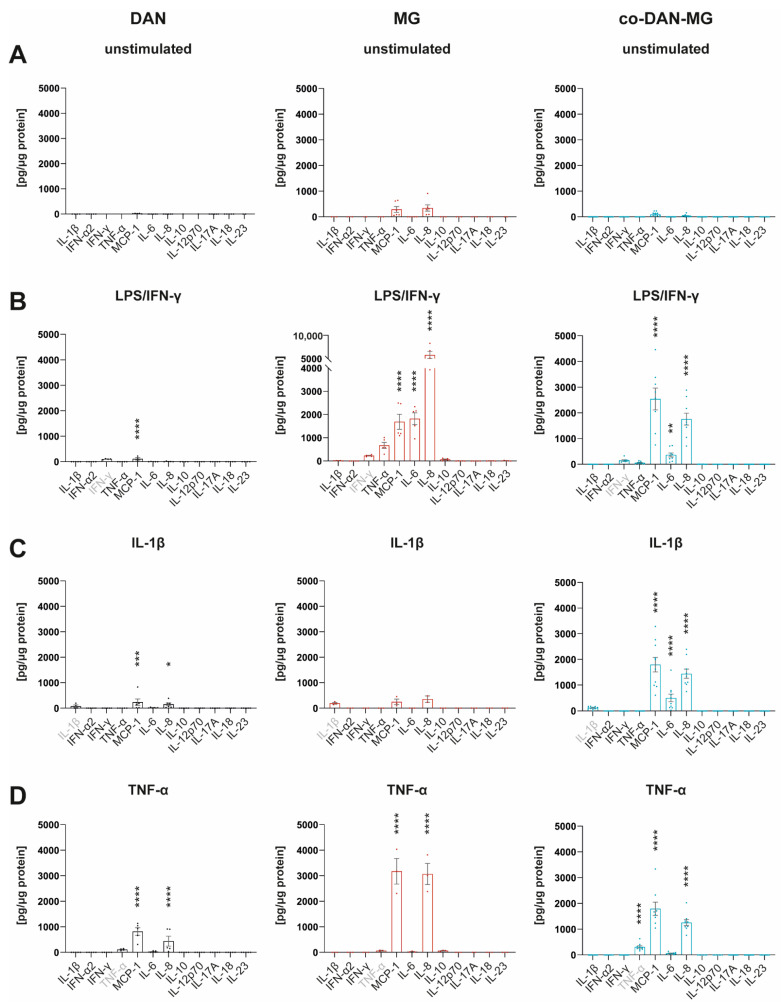
Figure 2.
Cytokine profiles of iPSC-derived dopaminergic neurons, microglia, and co-cultures. Simultaneous measurement of 12 cytokines in cell culture media by FACS using Legendplex Human Inflammation Panel 1 under (A) unstimulated basal conditions and after stimulation of cells with (B) LPS/IFN-γ, (C) IL-1β, and (D) TNF-α for 24 h. Gray-marked cytokines show measurement of the cytokine used for the respective treatment. Cell culture media of three different lines derived from healthy controls were analyzed: SFC086-03-03, SFC089-03-07, and SCF156-03-01. DAN: n = 5 differentiations of 1-3 lines per differentiation experiment, MG: n = 2 differentiations of 3 lines each, and co-DAN-MG: n = 10 differentiations of 1–2 lines per differentiation experiment. Asterisks indicate significant difference between unstimulated and stimulated cultures by two-way ANOVA followed by Sidak’s multiple comparisons test (* p < 0.05, ** p < 0.01, *** p < 0.001, **** p < 0.0001).

