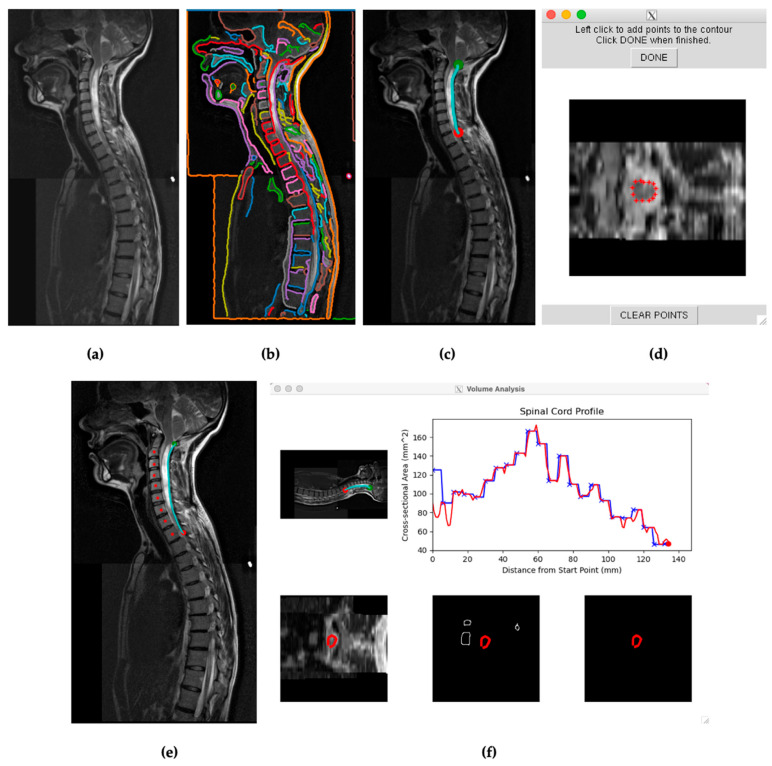
Figure 2.
(a) Visual from SCAT of a stitched sagittal spine scan for subject 29. (b) SCAT program edge detection software presenting continuous edges throughout the T2 scan. Each identified edge is visually represented in a distinct color. (c) Selected edge on the posterior surface of the spinal cord encompassing the length of the syrinx in the cervical spine between the green and red points. (d) Initial calibration for SCAT to measure edges across axial slices. (e) Mapping the spine for vertebral analysis. (f) Initial cross-sectional measurements of subject 29′s spinal cord across the selected edge before, blue, and after, red, vertebral analysis.

