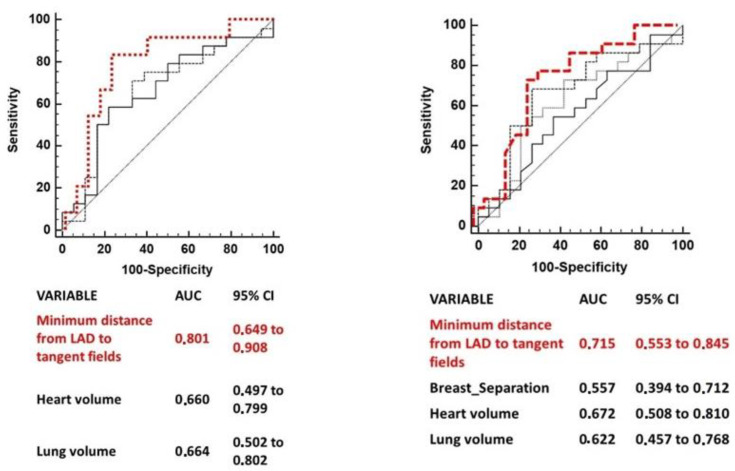
Figure 2.
ROC curve comparison of predictors of LAD maximum dose >10 Gy (Left) and of LAD mean dose >4 Gy (Right). Legend: for left ROC curve in red minimum distance from LAD to tangent fields, medium dashed line lung volume, continuous line hearth volume; for right ROC curve in red minimum distance from LAD to tangent fields, medium dashed line hearth volume, thin dashed line lung volume, continuous line breast separation.

