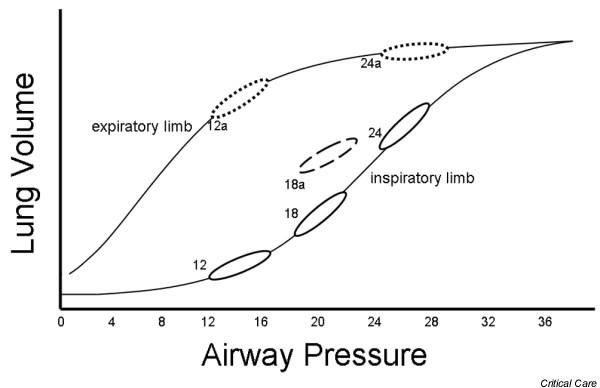
Figure 2.

Pressure–volume curve demonstrating tidal ventilation at various positive end-expiratory pressure levels. Tidal ventilation is shown at 12, 18 and 24 cmH2O with no recruitment effect (solid lines); at 18 cmH2O with partial recruitment (18a), and at 12 and 24 cmH2O following an effective recruitment manuever (12a, 24a).
