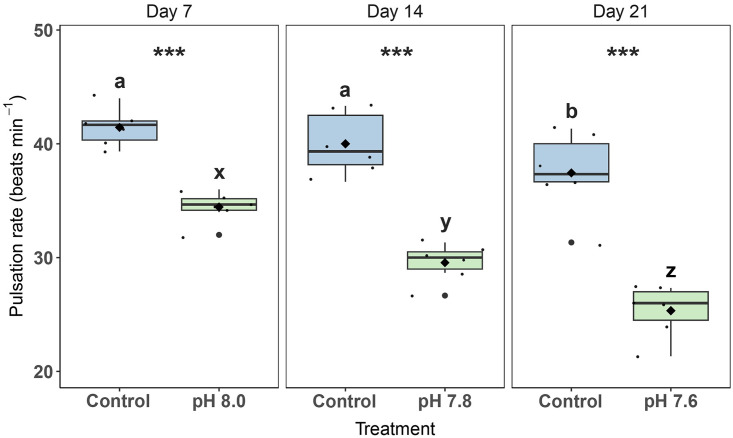
Fig 1. Pulsation rates of Xenia umbellata exposed to ocean acidification (OA).
The black horizontal line in each boxplot represents the median, while the black diamond represents the mean. Blue boxplots are controls; green boxplots are the OA treatments. Small black circles represent data points (ntreatment = 6), and big black circles represent outliers. Significant differences (p < 0.05) within treatments between days are shown by different letters, while differences between treatments per day are shown by asterisks (*** p < 0.001).

