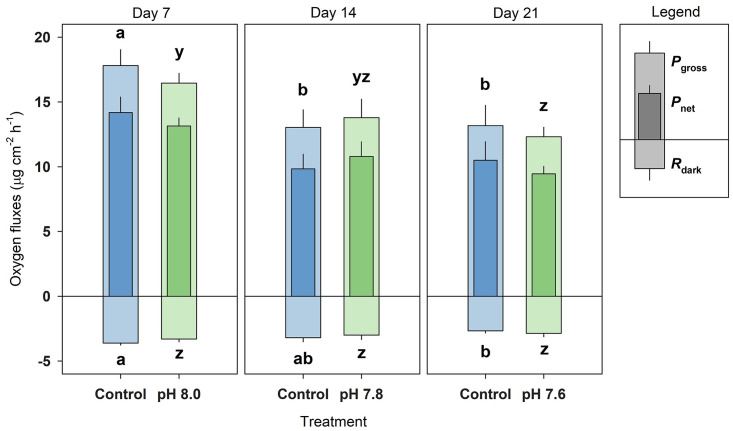
Fig 4. Oxygen fluxes of Xenia umbellata exposed to ocean acidification (OA).
Pgross = gross photosynthesis, Pnet = net photosynthesis, and Rdark = dark respiration. Blue bars represent the control; green bars represent the OA treatments. Bars are mean ± standard error (ntreatment = 6). Significant differences (p < 0.05) within treatments between days are shown by different letters (Pgross and Pnet share the same significance letters), while no significant differences were found between treatments per day.

