
Figure 1.
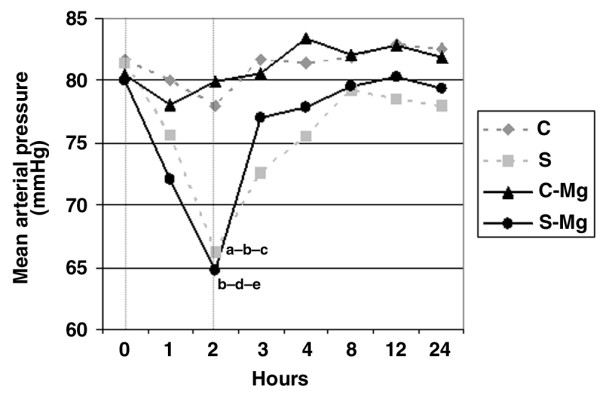
Hemodynamic data. Groups: sham control (C, n = 8), sham control MgSO4-treated (C-Mg, n = 8), septic (S, n = 8) and septic MgSO4-treated (S-Mg, n = 8). Mean arterial pressures compared among four groups using a Kruskal–Wallis analysis of variance followed by Dunn's multiple comparisons test. aSeptic versus sham control, P < 0.05. bSeptic versus sham control MgSO4-treated, P < 0.05. cAt 2 hours after the induction of sepsis versus baseline value (in the septic group), P < 0.01. dSeptic MgSO4-treated versus sham control MgSO4-treated, P < 0.01. eAt 2 hours after the induction of sepsis versus baseline value (in the septic MgSO4-treated group), P < 0.05. A Friedman nonparametric repeated-measures test was used for within-group comparisons.