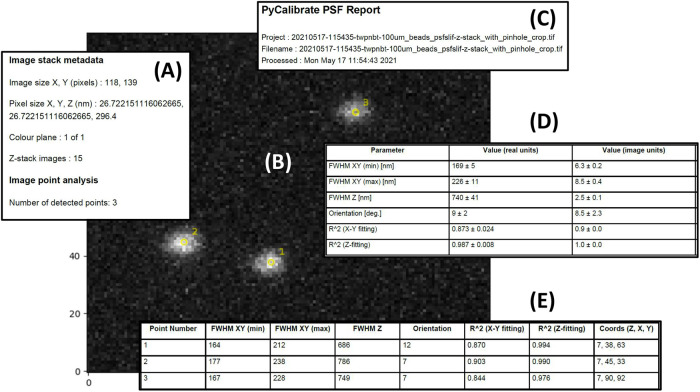
Fig. 2.
Key features of the PyCalibrate analysis results PDF summary. The PDF includes a description of the retrieved file metadata (A), a maximum intensity projection of the data set (B), a time stamp for the analysis together with the name of the file used (C), the lateral and axial dimensions of the detected features, both averaged across the field of view (D) and enumerated for each feature individually (E).

