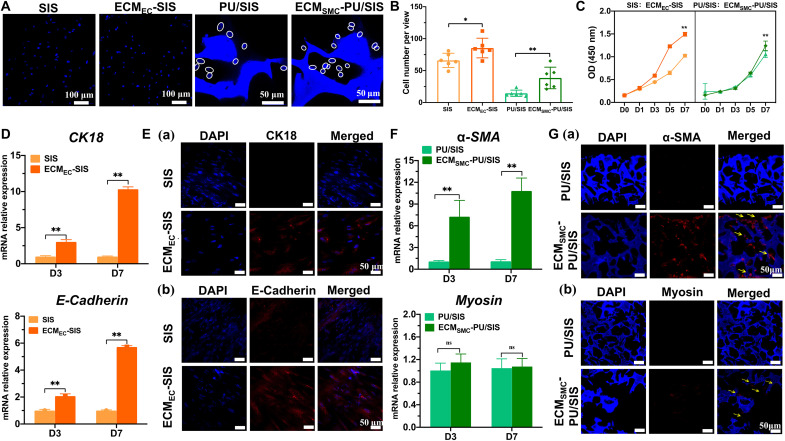
Fig. 4. Behaviors of the MSCs as regulated by the ECMEC-SIS and ECMSMC-PU/SIS in vitro.
(A) The numbers of cells attached to the ECMEC-SIS (scale bar, 100 μm) and ECMSMC-PU/SIS were determined by DAPI staining (scale bar, 50 μm). The circles have marked the nuclei. (B) Quantification of cell number attached to the scaffold (n = 6 independent samples, *P < 0.05 and **P < 0.01). (C) The proliferation curve of the MSCs cultured with extracts of the ECMEC-SIS and ECMSMC-PU/SIS as evaluated by the CCK-8 assay (n = 5 independent samples, **P < 0.01). (D) Relative mRNA expression of CK18 and E-Cadherin in the MSCs cultured with the SIS or ECMEC-SIS (n = 3 independent samples, **P < 0.01). (E) Immunofluorescence staining of CK18 (Ea) and E-Cadherin (Eb) in the MSCs cultured with the SIS or ECMEC-SIS. Scale bars, 50 μm. (F) Relative mRNA expression of α-SMA and myosin in the MSCs with the PU/SIS or ECMSMC-PU/SIS (n = 3 independent samples, **P < 0.01 and ns). (G) Immunofluorescence staining of α-SMA (Ga) and myosin (Gb) in the MSCs with the PU/SIS or ECMSMC-PU/SIS. Scale bars, 50 μm.

