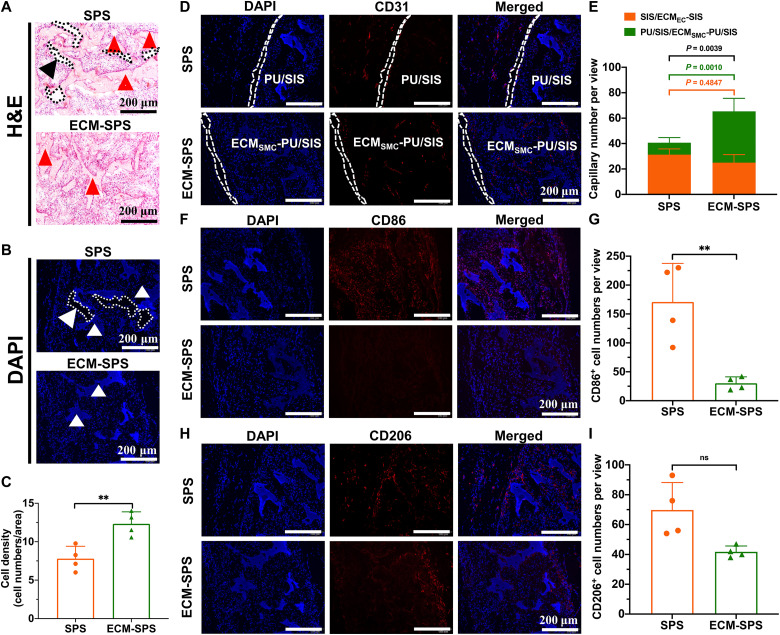
Fig. 5. In vivo cellularization, vascularization and immunogenic properties of the SPS and ECM-SPS 4 weeks after the surgery.
(A) H&E and (B) DAPI staining of the cross sections showing cell infiltration within the SPS and ECM-SPS. The arrowheads indicated the scaffolds, and the dotted lines marked the blank area between the SPS and surrounding tissue. Scale bars, 200 μm. (C) Quantification of cell numbers within the SPS and ECM-SPS (n = 4 independent samples, **P < 0.01 and ns). (D) CD31 immunofluorescent staining showing vascularization within the scaffolds. The SIS layer and ECMEC-SIS layer were marked with the dashed lines. Scale bars, 200 μm. (E) Quantification of capillaries number within the SPS and ECM-SPS (n = 4 independent samples, *P < 0.05, **P < 0.01, and ns; orange represents SIS group or ECMEC-SIS group, and green represents PU/SIS group or ECMSMC-PU/SIS group). (F) M1 macrophages as detected by CD86 immunofluorescence staining. Scale bars, 200 μm. (G) Quantification of CD86 positive cell numbers within the SPS and ECM-SPS (n = 4 independent samples, **P < 0.01). (H) M2 macrophages as detected by CD206 immunofluorescence staining. Scale bars, 200 μm. (I) Quantification of CD206-positive cell numbers within the SPS and ECM-SPS (n = 4 independent samples, ns).

