Figure 3.

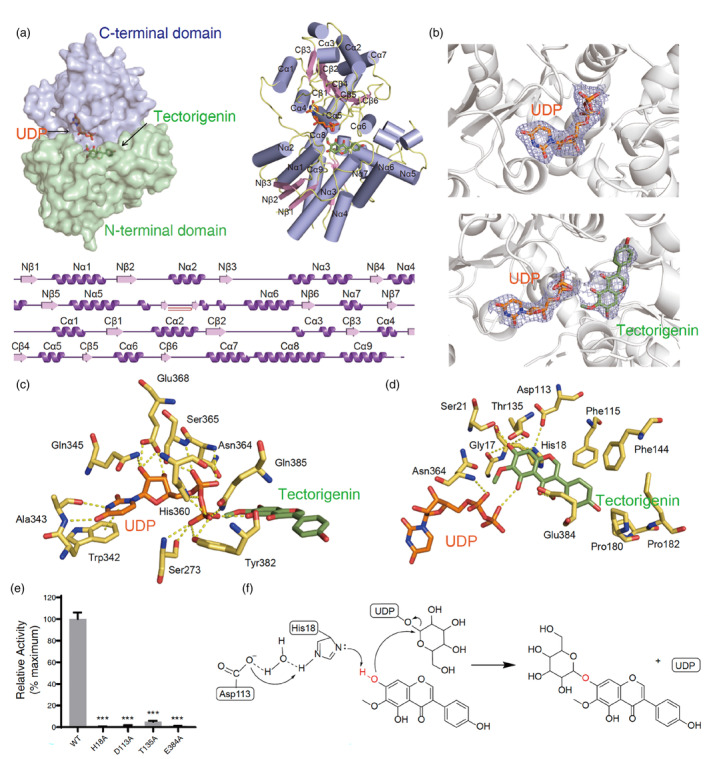
Structural basis for the glycosylation mechanism of Bc7OUGT. (a) Surface (left), cartoon (right), and secondary structure (bottom) representation of the structure of Bc7OUGT. The N‐terminal domain (NTD) and C‐terminal domain (CTD) are shown in green and purple respectively. The α helices are shown in dark purple and the β strands are shown in pink. (b) The electron density of Bc7OUGT with UDP (upper) or with UDP and tectorigenin (lower). The 2F o –F c map is contoured at 1σ. The structure of Bc7OUGT is represented as cartoon in grey colour, UDP is shown as a coloured stick diagram, and atoms are coloured by element (carbon: orange; nitrogen: dark blue; oxygen: red; phosphorus: dark orange), tectorigenin is also shown as a coloured stick diagram, and atoms are coloured by element (carbon: green; oxygen: red). (c) Interactions between UDP and the residues of Bc7OUGT. Hydrogen bonds are represented by yellow dashed lines. Atoms are shown in stick models and are coloured by element. (d) Interactions between tectorigenin and Bc7OUGT residues. Hydrogen bonds are represented by yellow dashed lines. (e) Relative glycosylation activities of wild‐type Bc7OUGT and its mutants. Significance was tested by a two‐tailed unpaired t‐test method (N = 3, error bars, mean ± SD) with asterisks indicating P‐value (***P < 0.001). (f) Proposed glycosylation mechanism of Bc7OUGT.
