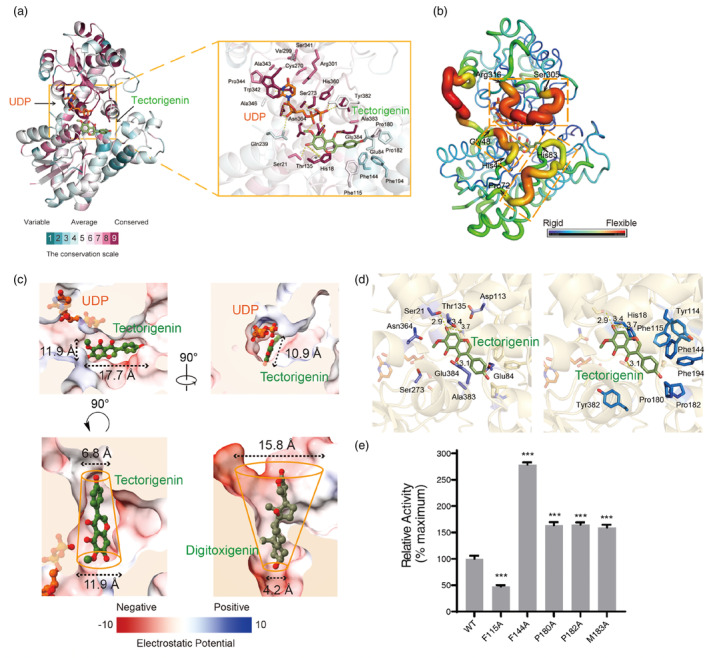
Figure 4.

Catalyse mechanism of the substrate recognition of Bc7OUGT. (a) The three‐dimensional structure diagram and the substrate‐binding pocket diagram of conserved sequence analysis of Bc7OUGT. (b) The three‐dimensional structure diagram of B factor analysis of Bc7OUGT. Three loop regions of high B factor are marked by yellow dashed boxes. (c) Upper panel—the electrostatic potential surface map of the substrate‐binding pocket of Bc7OUGT. Lower panel, the comparison of the substrate‐binding pockets between Bc7OUGT and UGT74AN2 (PDB: 7W1B). The top and bottom diameters are labelled. (d) The acceptor‐binding pocket of Bc7OUGT. Aromatic or hydrophobic residues are represented by blue sticks, other residues are represented by purple sticks. (e) Relative glycosylation activities of wild‐type Bc7OUGT and its mutants. Significance was tested by a two‐tailed unpaired t‐test method (N = 3, error bars, mean ± SD) with asterisks indicating P‐value (***P < 0.001).
