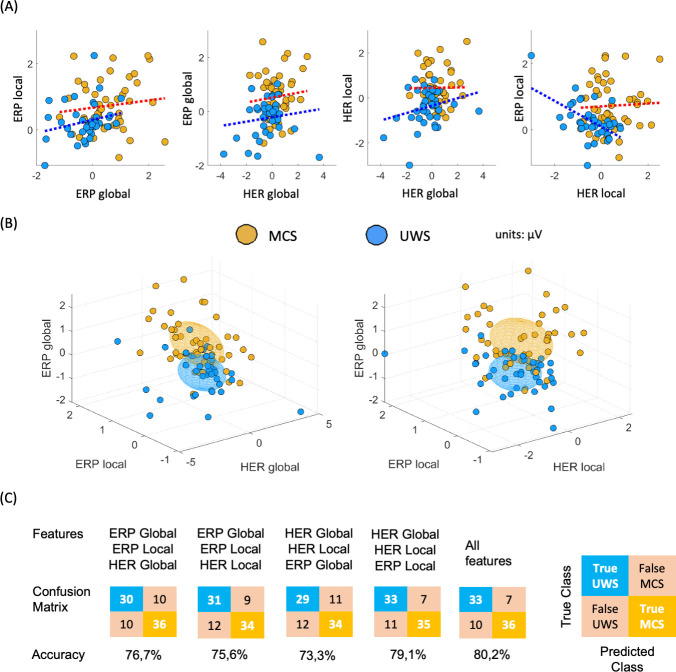
Figure 4. Multi-dimensional analysis of the clustered effects found when comparing MCS and UWS patients.
(A) Pairwise comparison between all possible combinations for ERPs and HERs, for local and global effects. Individual points corresponding to a single patient, and dotted line indicates the trend, separately per diagnosis. (B) Three-dimensional representation of the clustered effects: left panel for ERP global, ERP local, and HER global; and right panel for ERP global, ERP local, and HER local. Each ellipsoid was constructed per diagnostic group, centered in the group means with a ratio defined by the standard deviations, for the respective dimensions. (C) Confusion matrices depicting the classification results of MCS and UWS patients using a linear discriminant classifier in a fivefold cross-validation. The classifiers were trained using all possible combinations of feature triads, as well as all four features. HERs: heartbeat-evoked responses, ERPs: auditory event-related potentials, MCS: minimally conscious state, UWS: unresponsive wakefulness syndrome.

