. 2023 Nov 3;12:e85930. doi: 10.7554/eLife.85930

Figure 1. The phosphoinositide 3-kinase (PI3K) pathway is required for cardiac fusion.

Dorsal views, anterior to the top, of the myocardium labeled with myl7 (A–E) at 22 somite stage (s) or Tg(myl7:egfp) (A'–E') at 20s. In contrast to a ring of myocardial cells in DMSO-treated embryos (A, A'), in embryos treated with PI3K inhibitors LY294002 (LY, B, B'), Dactolisib (Dac, C, C'), or Pictilisib (Pic, D, D') at bud stage or injected with dnPI3K mRNA (750 pg) at the one-cell stage (E, E') cardiac fusion fails to occur properly with embryos displaying either cardia bifida (B, C) or fusion only at the posterior end (D, E). Graphs depict the percentage (F) and range (G) of cardiac fusion defects in control and PI3K-inhibited embryos. Dots represent the percent of embryos with cardiac defects per biological replicate. Total embryos analyzed n = 37 (DMSO), 31 (20 μM LY), 39 (40 μM Dac), 38 (50 μM Pic), and 86 (dnPI3K). Blue – cardiac ring/normal; orange – fusion only at posterior end/mild phenotype, red – cardia bifida/severe phenotype. (H) Representative immunoblot and ratiometric analysis of phosphorylated Akt (pAkt) to Akt protein levels in DMSO- and LY-treated embryos reveals a dose-dependent decrease in PI3K activation. Bar graphs indicate mean ± standard error of the mean (SEM), dots indicate pAKT/AKT ratio per biological replicate, normalized to DMSO. Three biological replicates per treatment. One-way analysis of variance (ANOVA) tests – letter changes indicate differences of p < 0.05 (F, H). Scale bars, 40 μm (A–E), 42 μm (A'–E'). Raw data and full p-values included in the source file.

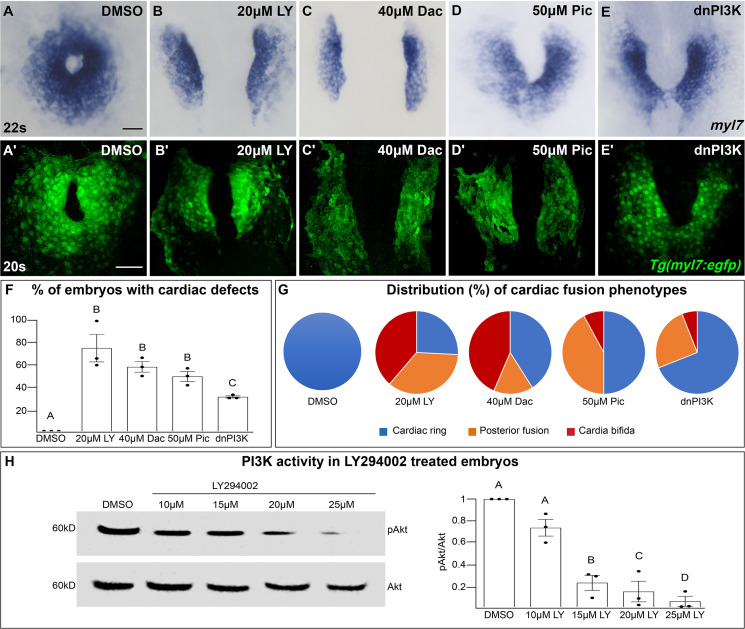
Figure 1—source data 1. Statistical source data for Figure 1F, H.
Figure 1—source data 2. Original immunoblots used in Figure 1H (raw, uncropped) with and without labeling.

Figure 1.

Figure 1—figure supplement 1. The penetrance and severity of cardiac fusion defects in phosphoinositide 3-kinase (PI3K)-inhibited embryos is dose dependent.

Figure 1—figure supplement 1.

(A–L) myl7 insitus labeling the myocardium at 22s. Incubation with LY (A–C), Dac (D–F), Pic (G–I) from bud stage to 22s or injection with dnPI3K mRNA (J–L) at the one-cell stage results in dose-dependent cardiac fusion defects at 22s. Graphs depict the distribution of cardiac fusion defects in embryos treated with increasing concentrations of LY (M), Dac (N), Pic (O), or dnPI3K mRNA (P). Both the percent of embryos displaying cardiac fusion defects and the severity of those defects are dose dependent. Number of embryos analyzed (n) at the indicated concentrations in (M–P) LY-40, 40, 30, 31, 31; Dac: 38, 34, 39; Pic: 37, 39, 38; dnPI3K mRNA: 73, 52, 61, 57, 52, respectively. Dots indicate the percent of embryos displaying a specific phenotype per incubation. Blue – cardiac ring/normal; orange – fusion only at posterior end/mild, red – cardia bifida/severe. Bar graphs, mean ± standard error. Representative immunoblot and ratiometric analysis of phosphorylated Akt (pAkt) to Akt protein levels in DMSO and Dac (Q), Pic (R), and dnPI3K mRNA (S) treated embryos reveals a dose-dependent decrease in PI3K activation. Bar graphs indicate mean ± standard error, dots indicate pAKT/AKT ratio per biological replicate, normalized to DMSO. At least three biological replicates per treatment. Letter change indicates p < 0.05, one-way analysis of variance (ANOVA). Scale = 60 μm. Raw data with full p-values included in the source file.
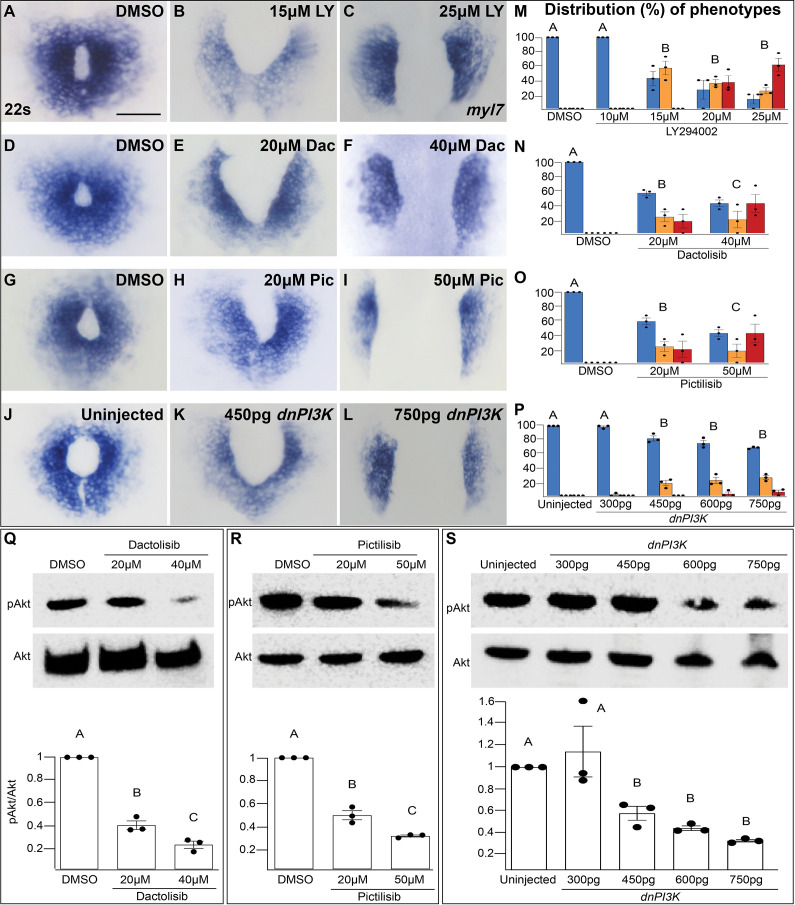
Figure 1—figure supplement 1—source data 1. Statistical source data for Figure 1—figure supplement 1M–O, P–S.
Figure 1—figure supplement 1—source data 2. Original immunoblots used in Figure 1—figure supplement 1Q–S (raw, uncropped) with and without labeling.
Figure 1—figure supplement 2. LY incubation results in trunk extension and somite formation delays.

Figure 1—figure supplement 2.

Lateral brightfield views of 20 hours post-fertilization (hpf) embryos treated with DMSO (A, D) or 20 μM LY (B, E) at bud stage. (C, F) Box-whisker plot depicting the median embryonic length (yellow curved line in A, B) or somite number (yellow dots in D, E) at 20 hpf. Total number of embryos (n) from >3 separate incubations = 40 (DMSO), 40 (20 μM LY) for (C), and 39 (DMSO), 42 (20 μM LY) for (F). Dots = measurements from individual embryos. Two-sample t-test; p-value = 4.527 × 10⁻⁴ and 7.624 × 10⁻⁵, respectively. (G–H) Dorsal views, anterior to the top, of the myocardium labeled with myl7 at 20 hpf. Embryos treated with DMSO at bud stage show cardiac rings (G) whereas those treated with 20 μM LY show cardia bifida at 20 hpf (H). (I) Graph depicts the average percentage of cardiac fusion defects in embryos treated with DMSO or 20 μM LY. The total number of embryos examined from three separate incubations (n) = 45 (DMSO), 45 (20 μM LY). Two-sample t-test; p-value = 4.56 × 10⁻⁵. Dots indicate the percent of embryos with cardiac fusion defects per incubation. Letter changes (C, F, I) indicate p-values <0.05. Raw data included in the source file.
Figure 1—figure supplement 2—source data 1. Statistical source data for Figure 1—figure supplement 2C, F, I.
Figure 1—figure supplement 3. Inhibition of mTOR activity does not affect cardiac fusion.

Figure 1—figure supplement 3.

(A–E) Myocardium visualized with myl7 expression at 22s in embryos treated at bud stage with increasing concentrations of rapamycin (Rap), an inhibitor of mTOR activity. (F) Bar graph displays the distribution of cardiac phenotypes at each rapamycin concentration from three replicates. Total number of embryos analyzed n = 45, 46, 45, 45, 44, respectively. Blue bar = cardiac ring/normal; scale bar = 40 μm. All embryos display cardiac rings, indicating normal cardiac fusion. (G) Representative immunoblot and ratiometric analysis of phosphorylated ribosomal protein S6 (pS6) – a read-out of mTOR activity, to S6 levels reveals that mTOR activity decreases with increasing concentrations of rapamycin. Letter change indicates p < 0.05, one-way analysis of variance (ANOVA). Raw data with full p-values included in the source file.
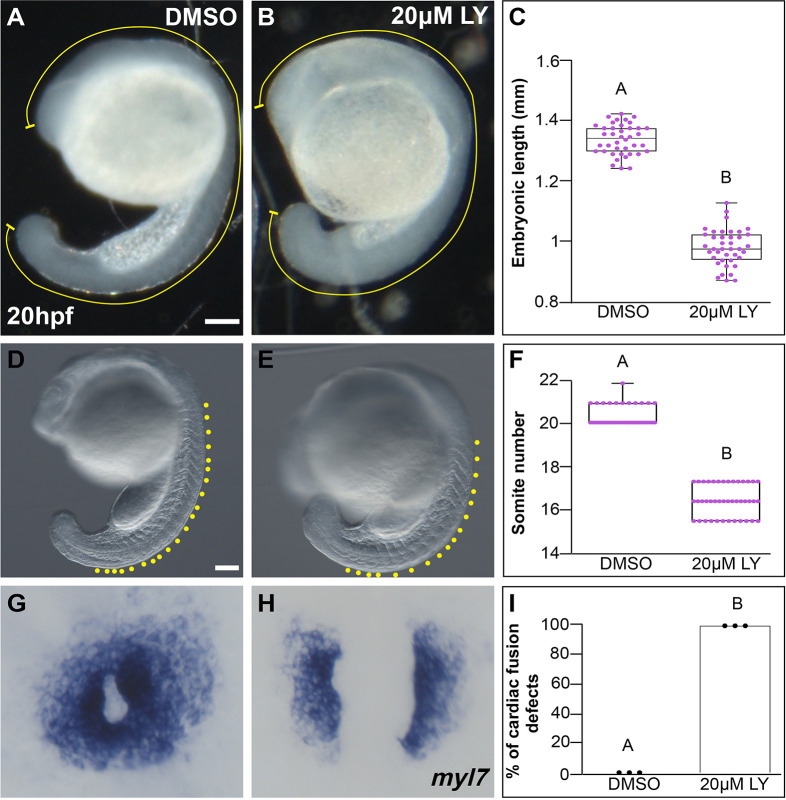
Figure 1—figure supplement 3—source data 1. Statistical source data for Figure 1—figure supplement 3F, G.
Figure 1—figure supplement 3—source data 2. Original immunoblots used in Figure 1—figure supplement 3G (raw, uncropped) with and without labeling.
Figure 1—figure supplement 4. Morphology and proliferation in the myocardium are not compromised in phosphoinositide 3-kinase (PI3K)-inhibited embryos.

Figure 1—figure supplement 4.

Representative transverse cryosections, dorsal to the top, compare the morphology of the myocardium, visualized with Tg(myl7:eGFP) (green), ZO1 (purple), and 4’,6-diamidino-2-phenylindole (DAPI, blue) between DMSO- (A–C) and 20 μM LY- (D–F) treated (bud stage to 20s) embryos. Box (A, D) indicates region magnified in (B, C, E, F). Arrows indicate second dorsal layer. (G–I) Representative images of the myocardium at 20s, which were used to count myocardial cells in DMSO- (G) or 20 μM LY- (H) treated embryos. Yellow dots indicate individual myocardial cells counted using ImageJ. Box-whisker plot displays median number of myocardial cells (I). (J–L) EdU incorporation into the myocardium at 20s in DMSO- (J) and LY- (K) treated embryos following a 1-hr pulse of EdU at 16s. Box-whisker plot displays median proliferation index (L). (M–P) TUNEL staining of Tg(myl7:eGFP) DMSO- and LY-treated embryos (M, N). TUNEL (TMR-red) only channel (M', N'). DMSO only or DMSO and DNAse-treated embryos (O, P). There was no difference in percent of TUNEL+ cardiomyocytes between DMSO- and LY-treated embryos (quantification in source file). n = 21, 25, 13, 8, 17, 19 embryos from 2 to 4 separate bud stage to 20s incubations from (G, H, J, K, M, N), respectively. Scale bars: 10 (A–F), 24 (G, H), 50 (J, K), 60 (M, N), and 10 (O, P) μm. No letter change indicates p > 0.05, two-sample t-test. Raw data and full p-values included in the source file.
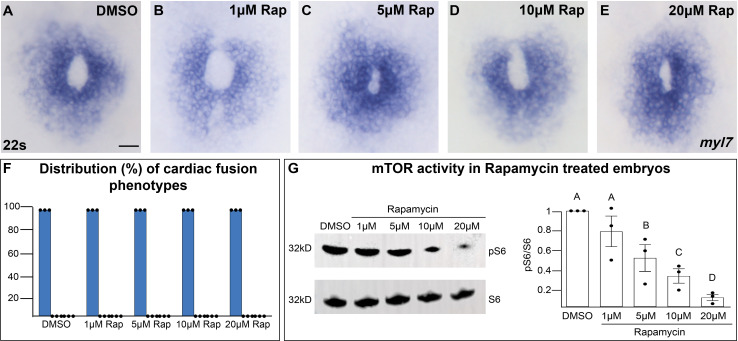
Figure 1—figure supplement 4—source data 1. Statistical source data for Figure 1—figure supplement 4I, L, M–P.
Figure 1—figure supplement 5. Loss of Pten, an antagonist of phosphoinositide 3-kinase (PI3K) activity, causes cardiac fusion defects.

Figure 1—figure supplement 5.

(A–I) Dorsal views, anterior to the top, of the myocardium labeled with myl7 at 22s. Neither ptena−/− homozygous mutants (A), ptena−/− homozygous; ptenb−/+ heterozygous (B), nor ptena−/−, ptenb−/− double homozygous mutants (C), display cardiac fusion defects. However, maternal contribution of Pten has been reported to persist during development. Adding low concentrations of the Pten inhibitor VO-OHpic (VO-OH – 5, 10 μM) at bud stage to ptena−/−, ptenb−/− double homozygous mutants to inhibit maternal Pten activity did cause a significant increase in cardiac fusion defects (H, I), compared to DMSO (D, G) and low concentrations of VO-OH only (E, F). The number of embryos with cardiac fusion defects and total number analyzed are indicated. (J) Bar graph depicts the distribution of cardiac fusion defects (% of embryos analyzed) in wild-type or ptena−/−, ptenb−/− double homozygous mutants, treated with DMSO, or 5, 10 μM VO-OH. Blue – cardiac ring/normal; orange – fusion only at posterior end. Fisher’s exact test, letter change indicates p < 0.05. Scale bar, 40 μm. Raw data including quantification of all genotypes and full p-values included in the source file.
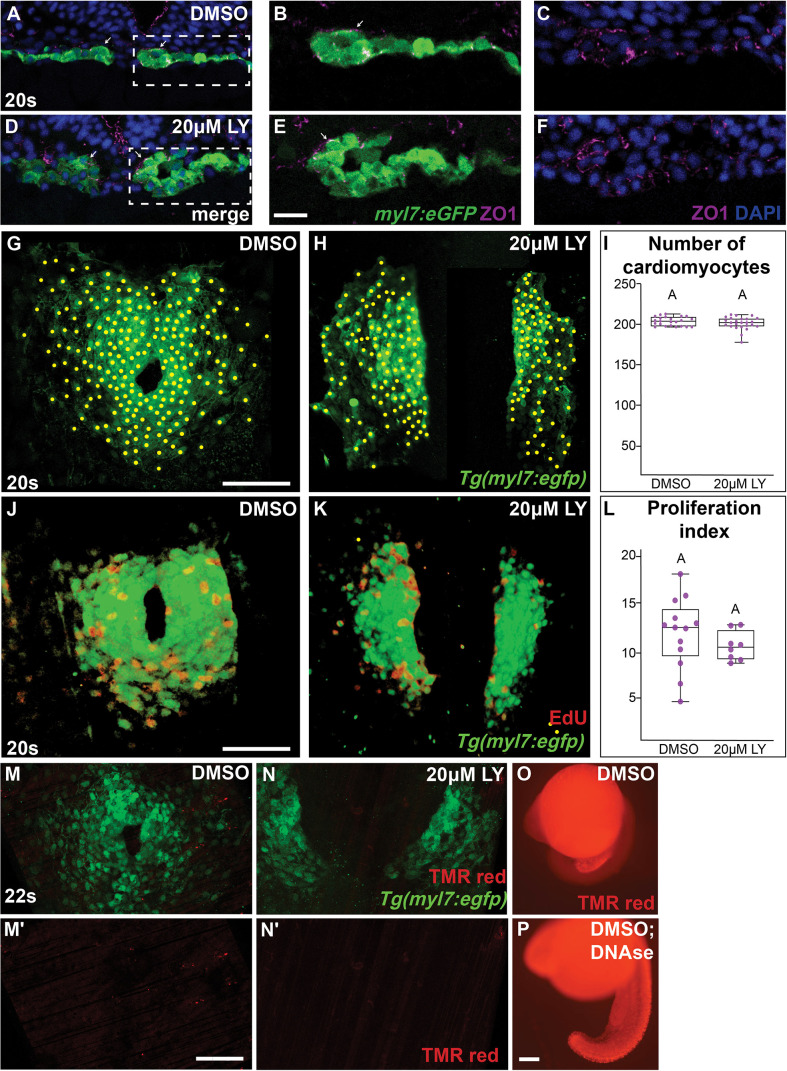
Figure 1—figure supplement 5—source data 1. Statistical source data for Figure 1—figure supplement 5J.
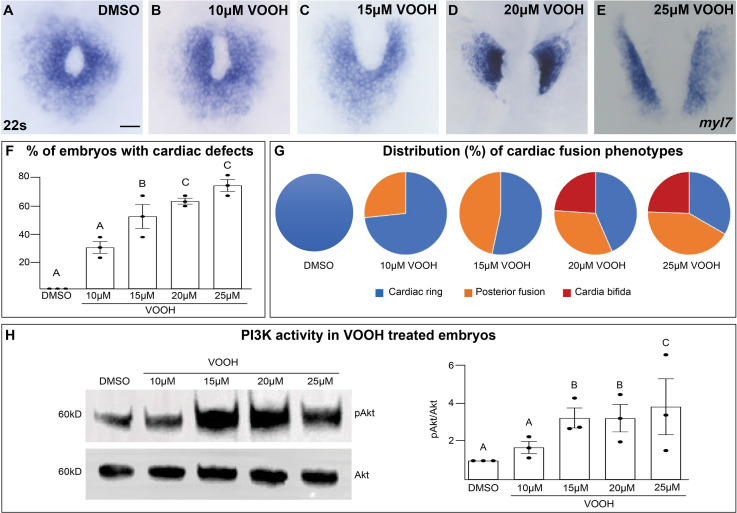
Figure 1—figure supplement 6. Inhibition of Pten activity with VO-OHpic increases pAkt and causes cardiac fusion defects.

Figure 1—figure supplement 6.

(A–G) Dorsal views of the myocardium labeled with myl7 at 22s in embryos incubated with increasing concentrations of the Pten inhibitor VO-OHpic (VO-OH) from bud stage to 22s. Graphs depicting the average % of embryos displaying cardiac fusion defects (F) and the distribution of cardiac fusion phenotypes (G). Blue – cardiac ring/normal; orange – fusion only at posterior end/mild phenotype, red – cardia bifida/severe phenotype. (H) Representative immunoblot and graph of ratiometric analysis of pAKT to AKT protein levels indicates increasing pAKT levels with increasing concentrations of the Pten inhibitor VO-OH. Three separate incubations per concentration (dots in F, H). n = 15 embryos per incubation per concentration (A–G). Letter change indicates p < 0.05, one-way analysis of variance (ANOVA). Raw data and full p-values included in the source file.
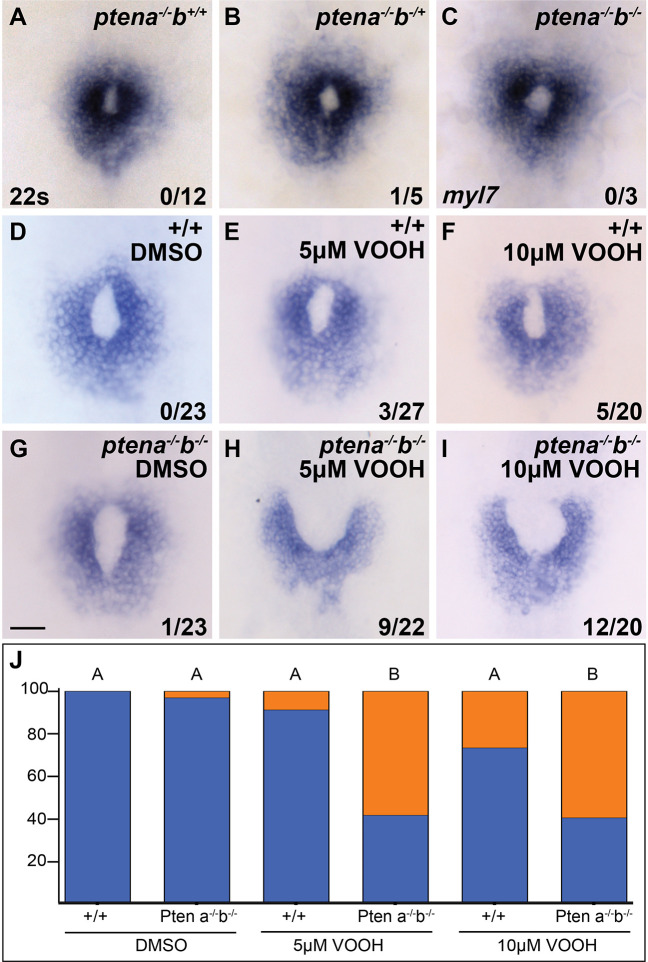
Figure 1—figure supplement 6—source data 1. Statistical source data for Figure 1—figure supplement 6F–H.
Figure 1—figure supplement 6—source data 2. Original immunoblots used in Figure 1—figure supplement 6H (raw, uncropped) with and without labeling.