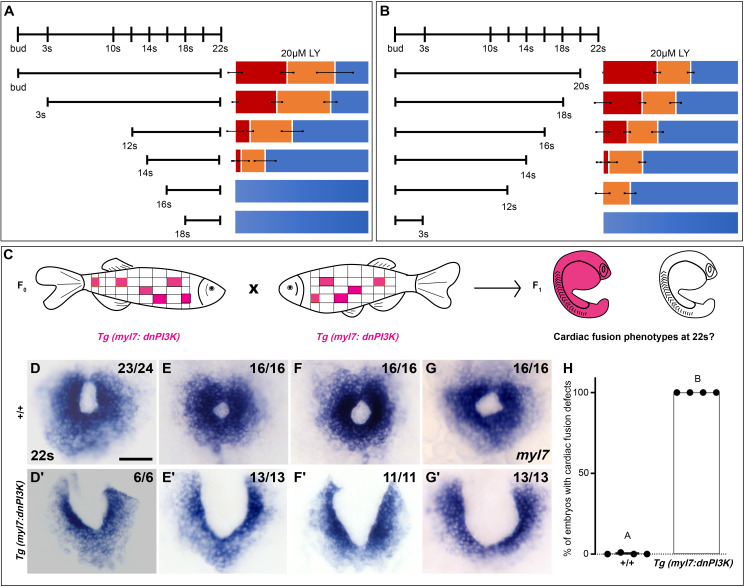
Figure 2. Phosphoinositide 3-kinase (PI3K) is required in the myocardium throughout cardiac fusion.
Graphical representation of the PI3K inhibitor addition (A) and wash-out (B) experiments used to determine the developmental stage over which PI3K is required. In (A) LY is added to embryos at different developmental stages and incubated until 22s, when cardiac fusion is assessed. In (B), LY is added at bud stage and washed-out at different developmental stages, after which embryos are incubated in normal media till 22s, when cardiac fusion is assessed. Bar graphs indicate the average proportion of embryos displaying different phenotypes. Blue – cardiac ring/normal; orange – fusion only at posterior end/mild phenotype, red – cardia bifida/severe phenotype. n = 45 embryos per treatment condition from three biological replicates. (C) Schematic outlines experimental design to test requirement for PI3K in the myocardium. Pink – cells with the Tg(myl7:dnPI3K) transgene. F0 animals are mosaic for the transgene, while all cells in F1 embryos either have the transgene (pink) or do not (white). The myl7 promoter restricts dnPI3K expression to the myocardium in Tg(myl7:dnPI3K) embryos. (D–G) Dorsal view of the myocardium labeled with myl7 in embryos at 22s from four different founder pairs (D–D', E–E', F–F', G–G'). F1 embryos without the Tg(myl7:dnPI3K) transgene (as determined by genotyping) display normal cardiac fusion (D–G, n = 23/24, 16/16, 16/16, 16/16, per founder pair), while F1 siblings with the Tg(myl7:dnPI3K) transgene display cardiac fusion defects (D'–G', n = 6/6, 13/13, 11/11, 13/13), indicating that PI3K signaling is required in myocardial cells. (H) Graph indicating the average % of wild-type and Tg(myl7:dnPI3K)+ embryos with cardiac fusion defects. Letter difference indicates a significant Fisher’s exact test, p = 5.56 × 10⁻³¹. Scale bar, 40 μm.


