. 2023 Nov 3;12:e85930. doi: 10.7554/eLife.85930

Figure 4. Myocardial membrane protrusions are misdirected in phosphoinositide 3-kinase (PI3K)-inhibited embryos.

(A–B'''') timepoints from representative videos (see Figure 4—video 1) of myocardial cells whose membrane has been labeled with myl7:lck-eGFP (black), medial to the right, in a DMSO- (A–A'''') or a 20 μM LY- (B–B'''') treated embryo. Red arrowheads indicate representative protrusions, which are mostly oriented medially, coincident with the direction of movement in DMSO-treated embryos (A–A'''') but are oriented in all directions in LY-treated embryos (B–B''''). Rose (C) and bar (D) graphs displaying the orientation of membrane protrusions in DMSO- (left) or LY- (right) treated embryos. The length of each radial bar in (C) represents the percentage of protrusions in each bin. Bar graph displays the total percentage of forward or backward protrusions. Forward protrusions: 270–90°, pink. Backward protrusions: 90–270°, black. n = 425 protrusions from 11 cells in 5 embryos (DMSO), and 480 protrusions from 11 cells in 4 embryos (20 μM LY). Fisher’s exact test, p-value 1.8 × 10⁻⁵. Mean ± standard error. Scale bar, 30 μm. Raw data included in the source file.

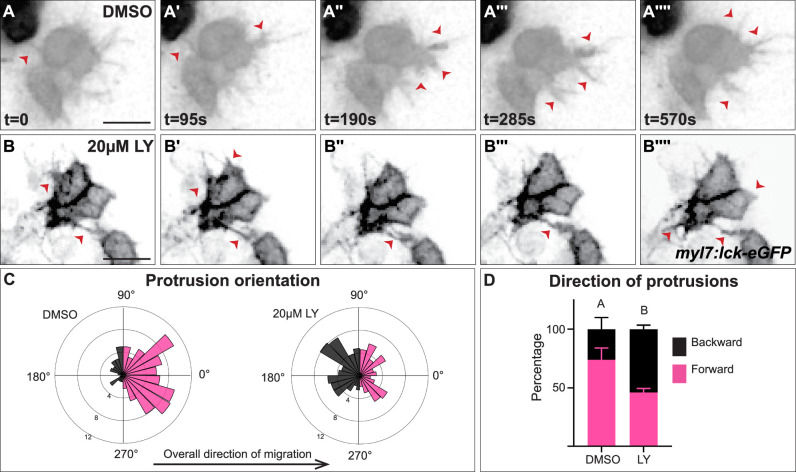
Figure 4—source data 1. Statistical source data for quantification of myocardial protrusion properties.

Figure 4.

Figure 4—figure supplement 1. Different types of myocardial protrusion morphologies occur during cardiac fusion.

Figure 4—figure supplement 1.

Snapshots from timelapse videos of myocardial cells mosaically labeled with myl7:lck-eGFP in a DMSO- (A) or a LY- (B) treated embryo. Purple arrowheads and green arrows indicate thin and wide protrusions, respectively. (C) Rose plots display the orientation of thin and wide protrusions in DMSO- (left) or LY- (right) treated embryos. Forward/medial direction: 270–90°. Backward/lateral direction: 90–270°. (D) Graphs indicate the average percentage of thin (purple dots) or wide (green dots) protrusions per cell per hour. Dots = individual cells. n = 425 protrusions from 11 cells in 5 embryos (DMSO), and 480 protrusions from 11 cells in 4 embryos (20 µM LY). Fisher’s exact test, p-value 3.866e-08. Mean ± standard deviation. Raw data included in the source file.
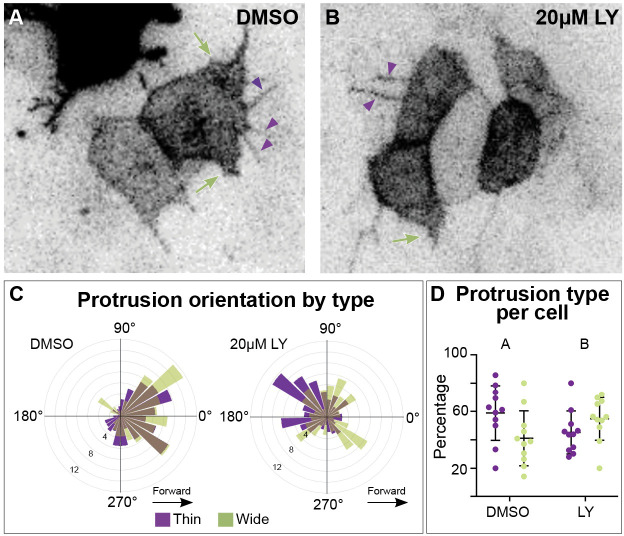
Figure 4—figure supplement 1—source data 1. Statistical and raw source data for Figure 4—figure supplement 1C, D.
Figure 4—video 1. Dynamic medially oriented myocardial membrane protrusions are lacking in phosphoinositide 3-kinase (PI3K)-inhibited embryos.
Download video file (1.5MB, mp4)
Representative time-lapse movies of myocardial membrane protrusions during cardiac fusion, visualized by injecting myl7:lck-eGFP plasmids at the one-cell stage, in DMSO- (left panel) or 20 μM LY- (right panel) treated embryos. Left panel highlights membrane protrusions (red arrowheads) in a set of posterior myocardial cells in a DMSO-treated embryo. Myocardial membrane protrusions in DMSO-treated embryos are mostly directed in the medial orientation (toward the right in both panels). Right panel highlights myocardial membrane protrusions (red arrowheads) in PI3K-inhibited embryos during cardiac fusion. Medial membrane protrusions (toward the right) are lacking in PI3K-inhibited embryos. DMSO or LY treatment from bud to 20s. Time-lapse movies are 3D reconstruction of confocal images of membrane protrusions taken at ~90-s intervals for 2 hr. Scale bar, 10 μm.