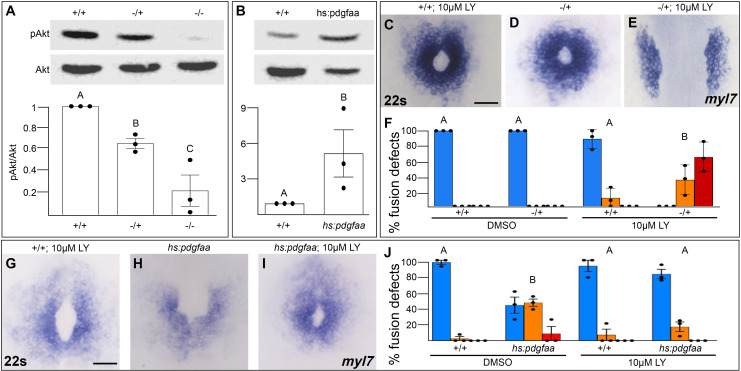
Figure 5. Pdgfra activates and genetically interacts with phosphoinositide 3-kinase (PI3K) signaling to regulate cardiac fusion.
(A, B) Immunoblot and ratiometric analysis of phosphorylated Akt (pAkt) compared to total Akt levels reveals reduced pAkt levels in loss-of-function pdgfrask16 heterozygous (−/+) or homozygous (−/−) mutant embryos at 22s (A), and elevated pAkt levels at 22s when PDGF signaling is activated with the Tg(hs:pdgfaa) transgene (B). Bar graphs display averages from three separate experiments. (C–E, G–I) Dorsal views, anterior to the top, of the myocardium labeled with myl7 at 22s. In contrast to a normal ring of myocardial cells found in wild-type embryos treated with 10 μM LY starting at bud stage (C) or in pdgfra heterozygous embryos (D), when pdgfra heterozygous mutants are exposed to 10 μM LY, cardiac fusion is defective with embryos displaying severe phenotypes such as cardia bifida (E). Furthermore, the percent of cardiac fusion defects observed in Tg(hs:pdgfaa) embryos heat-shocked at bud stage (H) is greatly decreased when heat-shocked Tg(hs:pdgfaa) embryos are exposed to 10 μM LY at bud stage (I). (F, J) Bar graphs depict the average distribution of cardiac fusion defects from the indicated genotypes. The total number of embryos examined over three separate replicates are 47 (DMSO, +/+), 25 (DMSO, −/+), 36 (10 μM LY, +/+), 31 (10 μM LY, −/+), 49 (heat-shock, DMSO, +/+), 57 (heat-shock, DMSO, Tg(hs:pdgfaa)), 51 (heat-shock, 10 μM LY, +/+), 57 (heat-shock, 10 μM LY, Tg(hs:pdgfaa)). Blue – cardiac ring/normal; orange – fusion only at posterior end/mild, red – cardia bifida/severe. Bar graphs, mean ± standard error. One-way analysis of variance (ANOVA) (A, F, J) or Student’s t-test (B), letter change indicates p < 0.05. Scale bar, 60 μm. Raw data and full p-values included in the source file.

