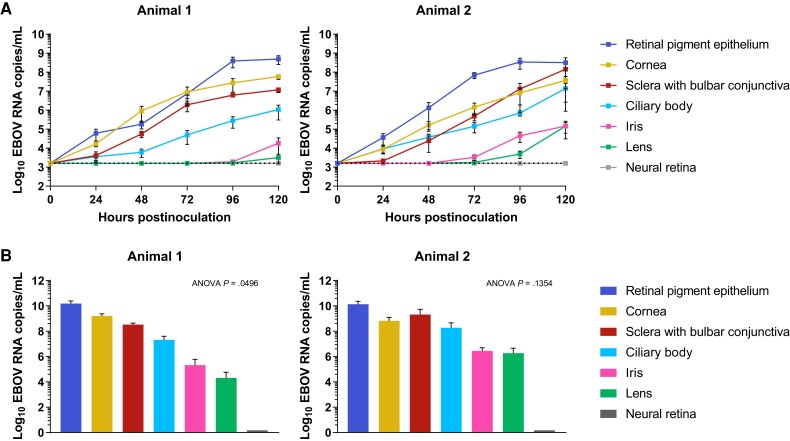
Figure 1.
Ebola virus (EBOV) growth in 7 ex vivo cynomolgus macaque ocular tissues. A, Growth curves for each tissue per animal. Individual points represent means and error bars represent standard error. The dotted line represents the limit of detection for the assay (3.2 log10 EBOV RNA copies/mL). Each tissue has 4 replicates per animal at every time point except for neural retina, which has only 2 replicates for animal 1 (2 were lost during the initial inoculation and washing procedure). No growth was detected in any of the neural retina replicates (gray line). B, Area under the curve for the growth curves by animal. Means are shown and error bars represent standard error. The P values for 1-way ANOVA are shown. Post hoc analysis of the 1-way ANOVA results with Tukey's multiple comparison test demonstrated no significant (P ≤ .05) differences between pairs of means.

