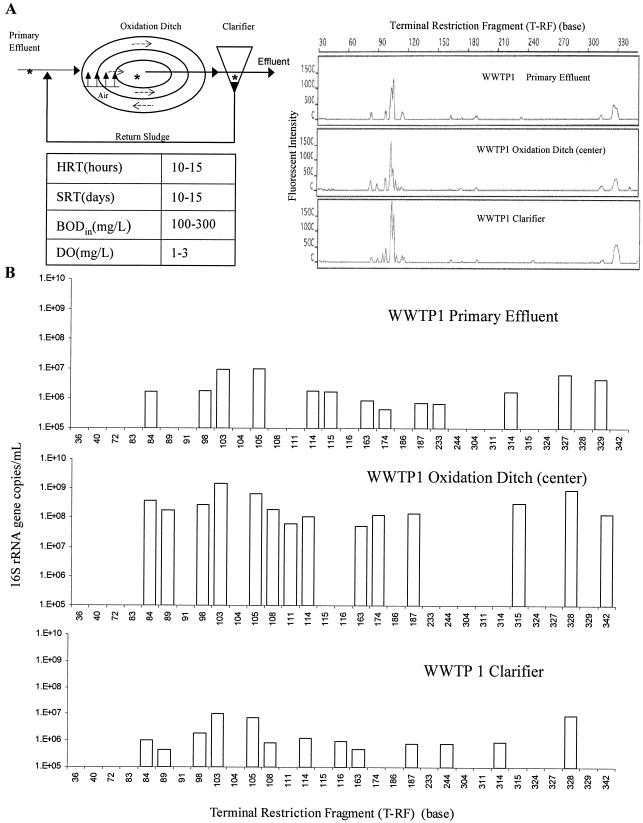
FIG. 4.
Changes in the microbial ecology of wastewater as treatment proceeds. (A) Diagram of WWTP1 and t-RFLP profiles of the microbial communities from the primary effluent, oxidation ditch, and clarifier. HRT, hydraulic retention time; SRT, solid retention time; BOD, biological oxygen demand; DO, dissolved oxygen. An asterisk indicates a sampling location. (B) Real-time-t-RFLP assay revealed the variation in the number of 16S rRNA gene copies per milliliter for each ribotype in the three wastewater samples examined.

