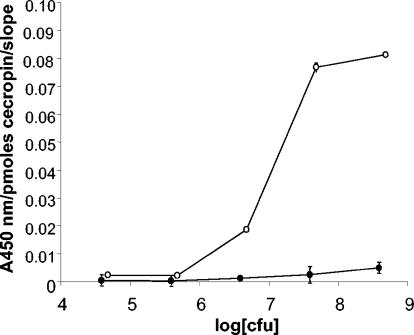
FIG. 3.
Comparison of binding curves for E. coli O157:H7 (○) and K-12 (•) with cecropin P1. Data were plotted as absorbance at 450 nm per picomole of cecropin per slope versus log CFU. The number of picomoles of cecropin reflects the amount of peptide coupled to the plate well surface, whereas the slope is the slope of the center of the binding curve for each strain binding to anti-E. coli antibody-horseradish peroxidase conjugate.

