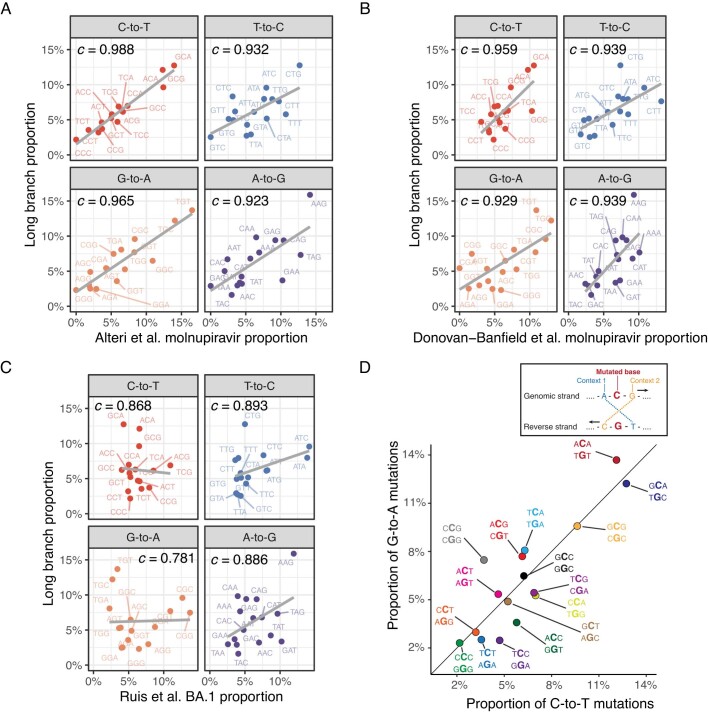
Extended Data Fig. 5. Mutation spectrum analysis supports a molnupiravir origin for high G-to-A nodes.
(A) Strong correlation for contexts in all transition mutation classes between Alteri et al. molnupiravir-treated patients and high G-to-A long branches. (B) Similar analysis, with clear correlation between Donovan-Banfield et al. dataset of molnupiravir treated individuals to long high G-to-A branches. (C) Little correlation seen between contexts in typical SARS-CoV-2 evolution (Ruis et al.) and high G-to-A branches. (D) In data from long branches, context proportions for G-to-A mutations correlate with context proportions for C-to-T mutations, indicating a common mutational process. Points are labelled with G-to-A context, then C-to-T context.

