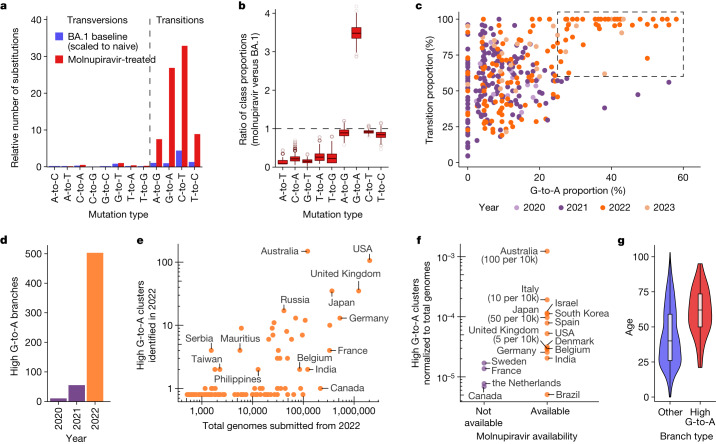
Fig. 2. A molnupiravir-associated mutational signature with high G-to-A and high transition ratio emerged in 2022 in some countries in global sequencing databases.
a, Comparison of the relative rate of different classes of mutations in typical BA.1 mutations versus those with molnupiravir treatment (molnupiravir data from Alteri et al.17 and naive data from Ruis et al.19, scaled to total mutations in naive individuals from Alteri et al.17; Methods) confirms an elevated rate of transitions, and particularly C-to-T and G-to-A mutations. b, Differences in the proportion of mutations of different mutation classes in individuals treated with molnupiravir (Alteri et al.17) versus typical BA.1 mutations (Ruis et al.19) highlight elevated G-to-A proportion as especially indicative of molnupiravir. These are ratios of proportions, so the apparent reduction in transversions does not require an absolute decrease in the number of transversions but can instead be caused by the increased number of transitions. The box plots depict variation over 1,000 bootstrap resamplings, with boxes showing the 25th, 50th and 75th percentiles, and the whiskers having a length 1.5× the interquartile range. c, A scatter plot where each point is a branch with more than 20 mutations, positioned according to the proportion of these mutations that are G-to-A (x axis) or transitions (y axis), reveals a space with elevated G-to-A and transition rate that occurs only with the roll-out of molnupiravir in 2022. d, A change at the same time point is seen when plotting the number of nodes with more than ten mutations and with G-to-A proportion greater than 25%, C-to-T proportion greater than 20% and transition proportion greater than 90%. e, Plotting the number of high G-to-A nodes identified in 2022 against the number of total genomes for each country revealed considerable variation. f, Countries confirmed to have made molnupiravir available had more high G-to-A nodes than countries that did not. The numbers in brackets represent the number of courses of molnupiravir supplied, normalized to population. P = 0.02 for a log-transformed, two-sided t-test. g, Age distribution for US nodes, partitioned according to whether they satisfy the high G-to-A criteria (P < 1 × 10⁻¹⁰, two-sided t-test). Age metadata are missing for some samples, probably non-randomly. Dataset sizes are n = 106 for the high G-to-A branches and n = 2,472 for the other branches. Where a node had many descendants of different ages, age was assigned using a basic heuristic, as described in the Methods. The box plot depicts the minimum, maximum, and the 25th, 50th and 75th percentiles.

