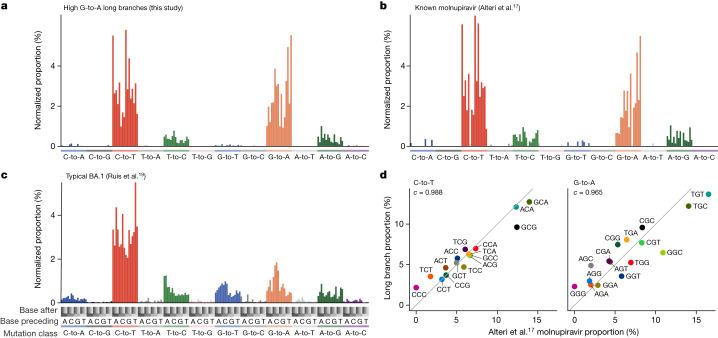
Fig. 3. Mutation spectrum analysis supports high G-to-A branches being driven by molnupiravir.
a–c, Single-base substitution mutation spectra for high G-to-A branches (a), individuals known to have been treated with molnupiravir (b) and typical BA.1 spectra (c). Each individual bar represents a particular type of mutation in a particular trinucleotide context (Extended Data Fig. 4). Bars are grouped and coloured according to the class of mutation. Within each coloured group, bars are grouped into four groups according to the nucleotide preceding the mutated residue; then, each of these groups contains four bars according to the nucleotide following the mutated residue. The number of mutations has been normalized to the number of times the trinucleotide occurs in the reference genome, and then normalized so that the entire spectrum sums to 1. d, High correlations between spectra from Alteri et al.17 from patients known to have been treated with molnupiravir, and the spectra from high G-to-A branches identified in this study. Each point represents the normalized proportion of a particular trinucleotide context. Points are coloured so that a context for C-to-T mutations has the same colour as its reverse complement in G-to-A. The values denoted by c are cosine similarity scores.

