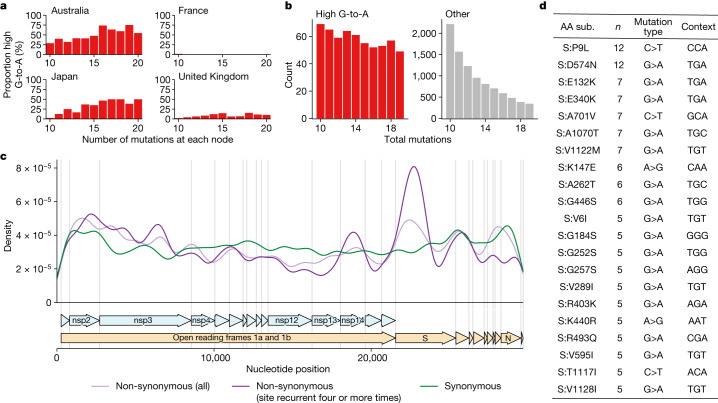
Fig. 5. High G-to-A branches make up a considerable proportion of long branches in affected countries and include evidence of selection.
a, Proportion of branches that are high G-to-A for a range of branch lengths in different countries. Data are from collection dates in 2022 and 2023 (submission dates up to June 2023). b, Branch length distributions for high G-to-A and other branches. c, Genomic distribution of mutations in high G-to-A nodes, partitioned into three classes: synonymous mutations; non-synonymous mutations; and non-synonymous mutations that occur four or more times. d, Table of the most recurrent mutations in S in high G-to-A branches. n = the number of high G-to-A branches exhibiting the mutation. Mutation type shows the parental and final nucleotide at the nucleotide position driving the mutation, while context shows the trinucleotide context for the mutated nucleotide, transcribed assuming a NC_045512.2 background.

