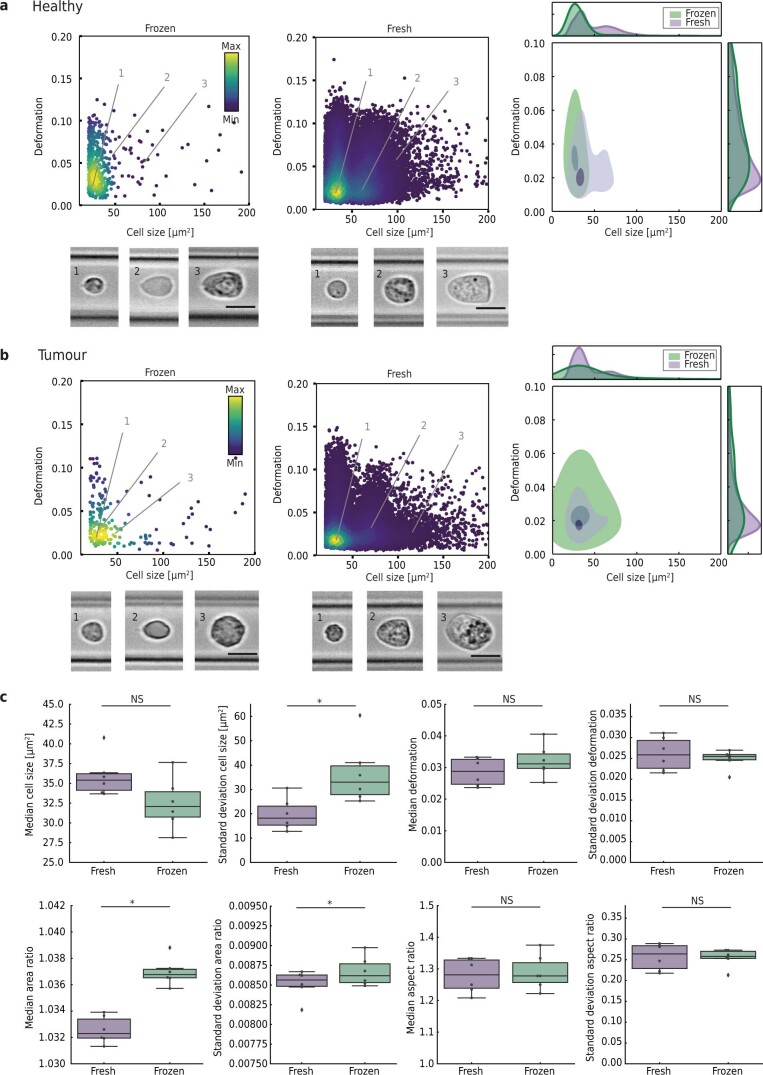
Extended Data Fig. 5. Comparison of physical phenotype parameters of cells from frozen and fresh human biopsy samples.
Cell size vs deformation scatter plots of single cells extracted from either fresh (purple) or frozen (green) colon biopsy samples; a, healthy sample; b, tumour sample; including 3 representative cell images for each plot with a scale bar = 10 μm2. The kernel density estimate (KDE) plots on the right correspond to the scatter plots on the left; the histograms show the distributions of cell size and deformation. c, Medians and standard deviations of cell size, deformation, area ratio and aspect ratio of fresh (N = 6) and corresponding frozen (N = 6) samples. Boxes extend from the 25th to the 75th percentile with a line at the median; whiskers span 1.5x the interquartile range. Statistical comparisons were performed using a two-sided Wilcoxon signed rank test, standard deviation cell size (*p = 0.0277, r = 0.64), median area ratio (*p = 0.0277, r = 0.64) and standard deviation area ratio (*p = 0.0277, r = 0.64); r: effect size; NS: non-significant.

