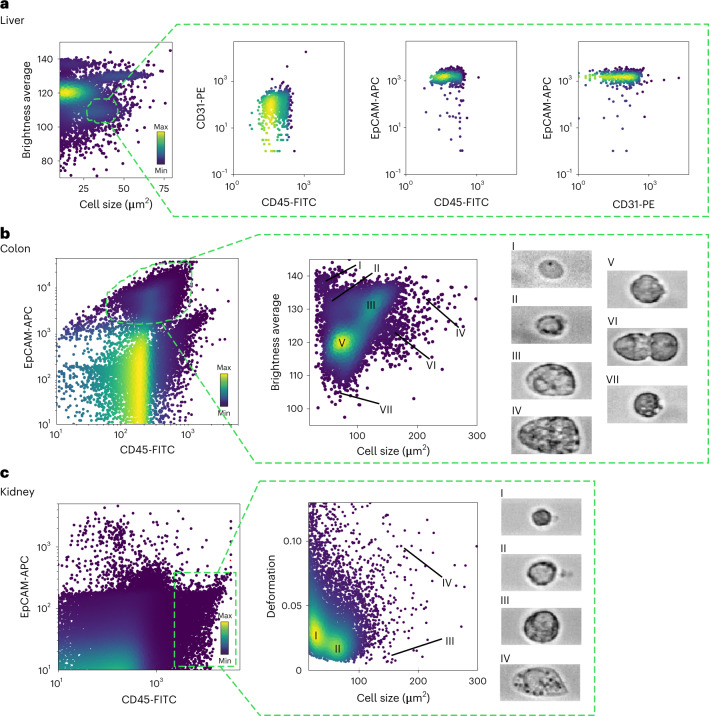
Fig. 2. Illustrative scatter plots of physical parameters of cells from murine liver, colon and kidney samples.
a, Illustrative scatter plot of brightness average versus cell size for cells isolated from the liver showing numerous clusters of cells. The marked population of cells (forming a cluster of cell size 25–50 μm2 and brightness average 100–115) is enriched for EpCAM-positive (epithelial) cells but devoid of CD31-positive (endothelial) cells or CD45-positive cells (leukocytes). FITC, fluorescein isothiocyanate; PE, phycoerythrin; APC, allophycocyanin. b, Illustrative scatter plots of colon cells stained for EpCAM and CD45 cell surface markers. Within the EpCAM-positive population, seven subpopulations of cells can be identified on the basis of density plots of physical parameters, such as brightness and cell size. c, Illustrative scatter plots of kidney cells stained for EpCAM and CD45. Within the CD45 population, four subpopulations are identified based on similarities in cell size and deformation. The colour map in the scatter plots represents the event density.

