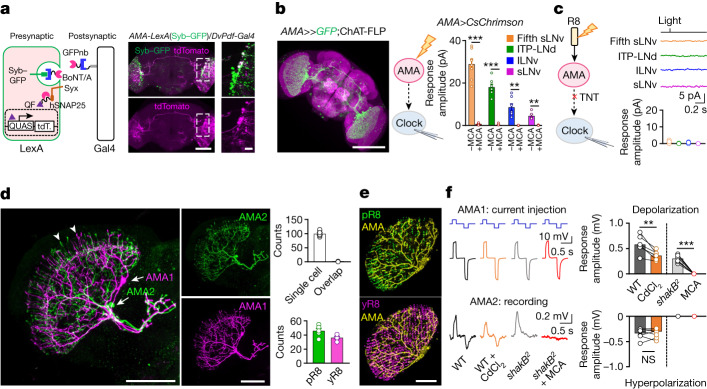
Fig. 4. A three-node circuit for circadian photoentrainment.
a, AMA neurons are presynaptic to clock neurons. Left: schematic of retrograde BAcTrace tracing; right: AMA neurons overlap with the BAcTrace-labelled presynaptic neurons of clock neurons. Scale bars, 20 µm. b, AMA neurons excite clock neurons through ACh signalling. Left: GFP expression intersected by ChAT-FLP and AMA-Gal4; scale bar, 100 µm. Middle: schematic of simultaneous optogenetic activation and patch-clamp recordings. Right: pooled responses of clock neurons to optogenetic activation of AMA neurons (with or without MCA). Light: 617 nm, 2 ms, 2.22 × 10⁹ photons μm−2 s−1. c, R8 photoreceptors excite clock neurons through AMA neurons. Left: schematic of TNT blockade of AMA transmission; right: a complete loss of R8-mediated light responses in clock neurons of AMA-Gal4 > TNT flies (top) and pooled data (bottom). Light: 470 nm, 2 ms, 5.56 × 10⁷ photons μm−2 s−1. d, Spatial irradiance integration by AMA neurons. Left: arborization of two MCFO-labelled AMA neurons; arrows indicate cell bodies and arrowheads indicate multicolumnar arborization. Middle: single MCFO-labelled AMA neurons. Top right: pooled counting data for dendritic branches of single AMA neurons and for dendritic branch overlaps between two AMA neurons. Scale bars, 50 µm. e, Co-labelling of pR8 or yR8 photoreceptors and AMA neurons. Pooled data counting the overlap between AMA dendritic branches and photoreceptor axons are shown on the bottom left. Scale bar, 50 µm. f, Electrical and chemical synapses among AMA neurons. Left: representative dual recordings (with current injection to AMA1) in wild-type flies (with or without 50 µM MCA) or shakB2 mutant flies (with or without 100 µM CdCl2); right: pooled peak response amplitudes of the AMA2 neuron. Hyperpolarization current: −30 pA; depolarization current: 30 pA. Pooled data are shown as mean ± s.e.m. **P < 0.01; ***P < 0.001; NS, not significant. Statistical analysis is summarized in Supplementary Table 2.

