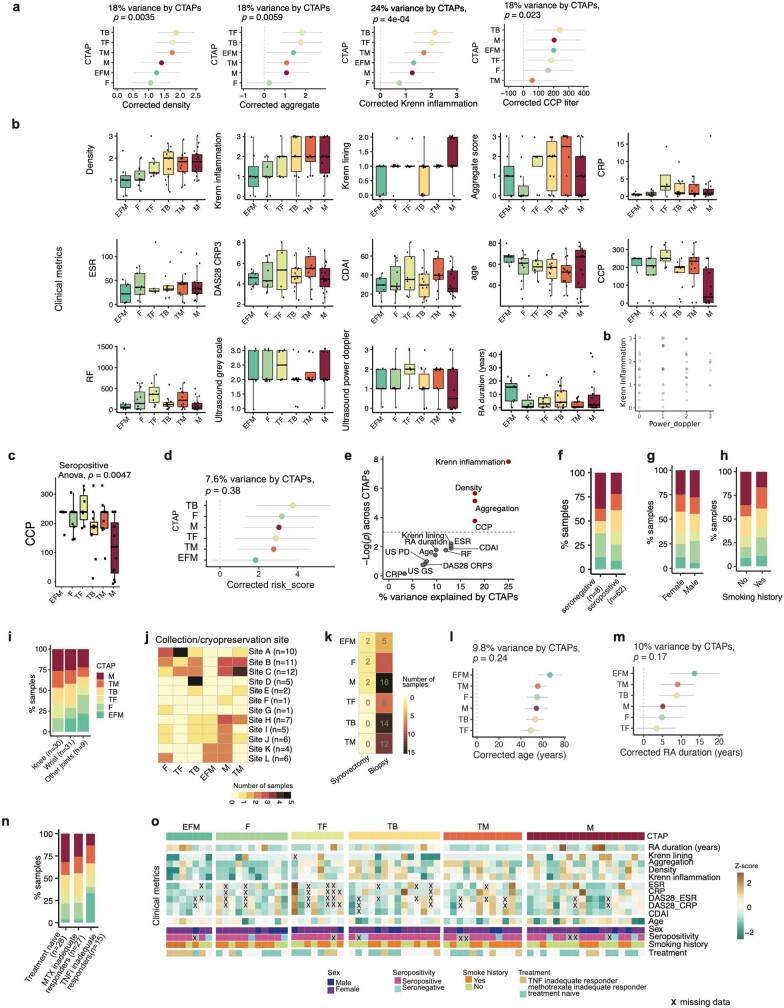
Extended Data Fig. 8. Association of single-cell RA CTAPs with different clinical characteristics.
a, Associations between clinical features and CTAPs (N = 70), adjusting covariates for age, sex, cell number, and clinical collection site. Percentage of variance explained by CTAPs alone and p-value are calculated with ANOVA tests. Points represent odds ratios and bars represent 95% confidence intervals. b, Clinical, histologic, and ultrasound parameters of patients in each CTAP. For all box plots, each dot represents an individual (N = 70); boxes show median (vertical bar), 25th and 75th percentiles (lower and upper bounds of the box, respectively) and 1.5 x IQR (or minimum/maximum values; end of whiskers), c, Dotplot of Krenn inflammation versus power doppler scores. Each point is a patient. d, CCP levels among seropositive patients alone (N = 59). Points represent individuals and box plots show median (vertical bar), 25th and 75th percentiles (lower and upper bounds of the box, respectively) and 1.5 x IQR (or minimum/maximum values; end of whiskers)., e, Corrected RA HLA-DRB1 risk scores and their associations with CTAPs, percent of variance explained by CTAPs only and p-value are calculated with ANOVA test, f, Clinical, demographic, and histologic metrics plotted by percentage of variance explained by CTAPs and the ANOVA p-value for its association with CTAPs. Features in red are significant at p < 0.05. g, CTAP frequency among seropositive (CCP-positive, RF-positive, or both) versus seronegative patients. h, CTAP frequency by sex. i, CTAP frequency by smoking history, j, CTAP frequency by anatomic site of synovial biopsy. k, Number of samples per CTAP in each collection/cryopreservation site. l, Number of patient samples for each CTAP between biopsy and synovectomy, m-n, Association of age and RA duration with CTAPs (N = 70), adjusting covariates for age, sex, cell number, and clinical collection site. Points represent odds ratios and bars represent 95% confidence intervals. Percentage of variance explained by CTAPs alone and p-values are calculated with one-way ANOVA tests. o, Sample distributions across CTAPs by recruitment cohort, p, Heatmap of clinical variables for patient samples grouped by CTAP. Boxes are colored based on z-score of the metric across samples. “X” represents missing data.

