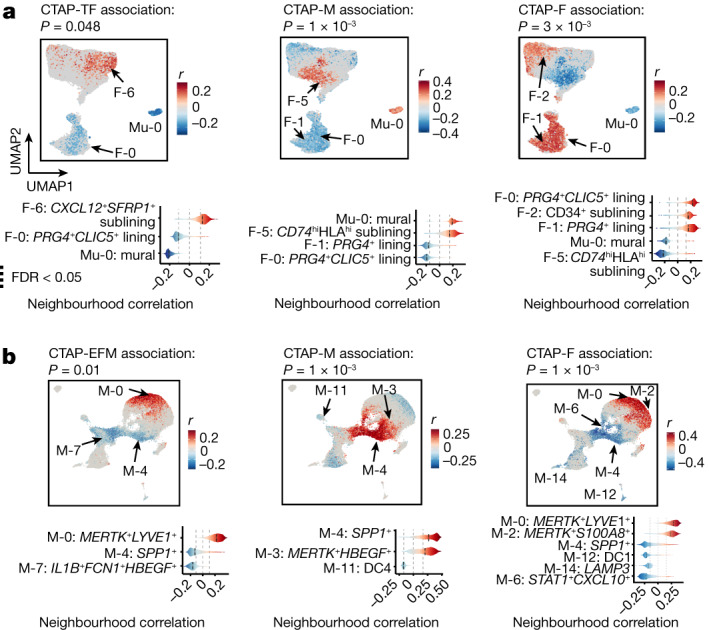
Fig. 4. Different stromal, myeloid and endothelial cell populations are associated with rheumatoid arthritis CTAPs.

a, Association of stromal cell neighbourhoods with CTAP-TF, CTAP-M and CTAP-F. b, Association of myeloid cell neighbourhoods with CTAP-EFM, CTAP-M and CTAP-F for all CNA results. Cells in UMAPs are coloured red (positive) or blue (negative) if their neighbourhood is significantly associated with the CTAP (FDR < 0.05), and grey otherwise. Distributions of neighbourhood correlations are shown for clusters with more than 50% of neighbourhoods correlated with the CTAP at FDR < 0.05. Global P values were obtained based on the permutation testing from the CNA package.
