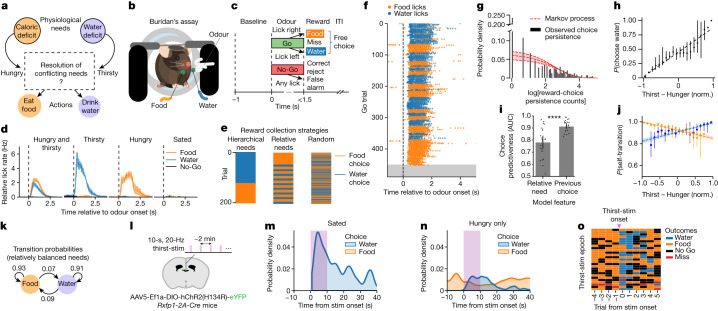
Fig. 1. Reward choice under conflicting needs is structured by persistent behavioural states with stochastic transitions.
a, The conceptual problem. b, Buridan’s assay. A food- and water-restricted mouse is head-restrained with two equally accessible reward spouts, delivering salted liquid food and water, respectively. c, Trial structure. Go odour indicates reward availability and No-Go odour indicates reward unavailability after a variable inter-trial interval (ITI). After Go-odour onset, mice freely choose food or water reward by licking right or left, respectively. d, Licking behaviour during Buridan’s assay under different restriction conditions. The y axis shows average lick rate at a given spout, multiplied by the fraction of licks to that spout per session. Data are mean ± s.e.m. n = 15 mice, 22 sessions for food and water restriction; n = 3 mice, 3 sessions for water or food restriction only; n = 2 mice, 2 sessions for no restrictions. e, Hypothetical reward-choice patterns under different strategies. f, Behavioural session showing food and water licks across trials until satiation (grey). g, Reward-choice persistence counts distribution for all behavioural sessions with both food and water restriction. Dashed red line indicates probability density for log[persistence counts] generated by a sticky Markov process (geometric distribution fit to data, maximum likelihood shape parameter P = 0.061, 95% confidence interval [0.05, 0.074]). h, Probability of choosing a water reward on rewarded Go trials, fit by linear regression (dashed line) to observed relative need (normalized (norm.) thirst − hunger). R2 = 0.92, slope = 0.426. Data are mean ± 95% confidence interval. The first and last two data points lack confidence intervals owing to too few data points. i, Prediction of current choice as a function of current needs or the most recent previous choice, based on a support vector machine model. AUC, receiver operating characteristic area under the curve. Data are mean ± 95% confidence interval. Two-sided paired t-test; n = 22 sessions, t = −5.89, P = 6.28 × 10⁻⁶. j, Self-transition probability fit by linear regression to normalized thirst − hunger. Data are mean ± 95% confidence interval. Water choice: R2 = 0.612, slope = 0.07; food choice: R2 = 0.844, slope = −0.077. k, Go-trial transition probability between reward choices. Probabilities are maximum likelihood estimates from trials with normalized thirst − hunger between −0.25 and 0.25. g–k, n = 15 mice, 22 sessions. l, Schematic of optogenetic activation of osmotic thirst (RXFP1+) neurons in the subfornical organ (green) in 10-s epochs during Buridan’s assay. m,n, Probability density (kernel density estimate) of food and water choices in Go trials as a function of optogenetic thirst stimulation (purple bars), in experiments on sated mice (m; n = 2 mice, 63 stim epochs) or on hungry-only mice (n; n = 2 mice, 69 stim epochs). o, Trial outcomes (colour-coded, right) surrounding each optogenetic thirst-stimulation epoch (rows; n = 27) from a single session on a hungry-only mouse.

