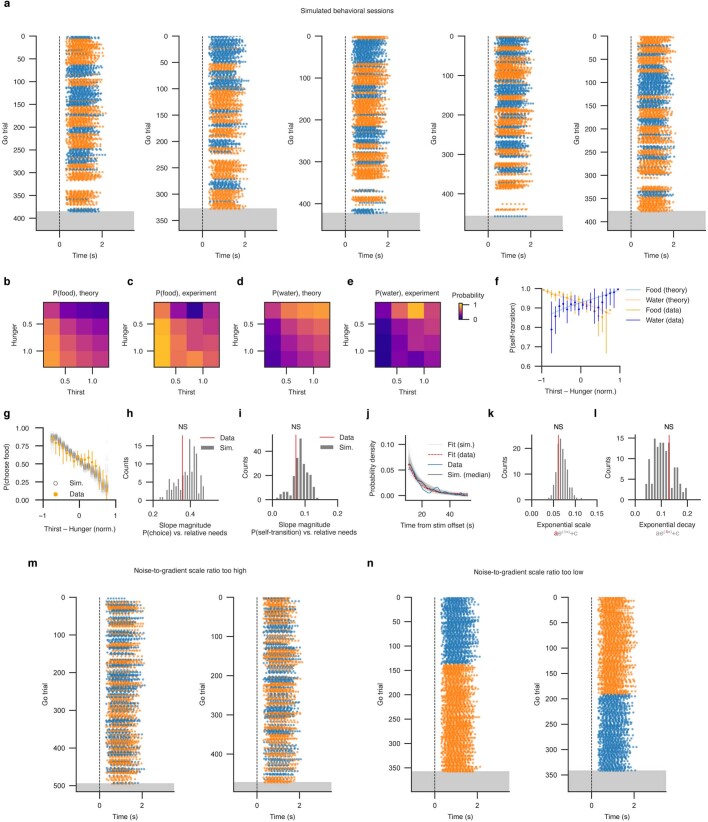
Extended Data Fig. 7. Theoretical and simulated behavioral statistics generated by the landscape diffusion model.
a, Additional examples of behavioral simulations from the landscape diffusion model with parameters used for the analyses of Fig. 3. Simulated sessions visualized as licking behavior (orange dots, food licks; blue dots, water licks) over the course of a session until satiation (grey region) from top (session start) to bottom (session end). Lick timing and number are drawn from a uniform distribution for visualization purposes. Vertical dashed line, odor onset. b–e, Binned probability of choosing food (b, c) or water (d, e), independent of previous reward choice, as a function of Thirst and Hunger. b, d, Theoretical predictions (Boltzmann equation) derived from the model using parameters fit to trial data (Methods). c, e, Binned experimental point probability estimates. f, Theoretical prediction of probability of repeating previous reward choice (water-to-water, blue; food-to-food, orange) as a function of normalized Thirst – Hunger. Solid dark dots and lines, binned point estimates of the self-transition probability for normalized Thirst – Hunger values, mean ± 95% confidence interval, based on experimental data (n = 15 mice, 22 sessions). Light lines, model-derived theoretical prediction of self-transition probabilities, using parameters fit to trial data (Methods). The derived equations in b, d, and f are used in the forward model parameter fitting procedure to maximize the probability of all observed trial outcomes (Methods). g, Probability of choosing food on rewarded trials, independent of previous reward choice, as a function of observed relative need (normalized Thirst – Hunger; Methods), for experimental data (n = 15 mice, 22 sessions) and simulation (128 simulations of 22-session datasets). Solid blue dots and vertical lines, data mean ± 95% confidence interval, superimposed on open gray dots, means of simulated sessions. h, i, Quantitative agreement between simulated session statistics and experimental data. Summary statistics quantified from repeatedly performing stochastic simulations (128 times) of a 22-session dataset form a distribution of summary statistic values (gray bars), against which two-sided tail statistics can be calculated using the experimentally-observed summary statistic values (red lines). h, Distribution of slope magnitudes given by linear fits between the probability of reward choice and normalized relative needs. Red line, observed slope magnitude given by linear fit between experimental choice probability and normalized relative need (slope magnitude averaged between food and water choice probability fits). The experimentally-observed slope magnitude is not significantly different from the slopes computed from simulated data (gray bars), P = 0.664. i, Distribution of slope magnitudes given by linear fits between the probability of repeating the previous choice on the subsequent trial (self-transition probabilities) and the normalized relative need. Self-transition probabilities as a function of normalized relative need are linearized over the range [–1, 0] for food-to-food and [0, 1] for water-to-water, where there are greater numbers of experimental observations. Slope magnitudes for food-to-food and water-to-water are averaged together. The experimentally observed self-transition probability slope magnitude (red line) is not significantly different from those observed in repeated simulation (gray bars), tail statistic P = 0.734. j–l, Quantitative agreement between the simulated optogenetic experiment and the experimental dataset, focusing on the decay of water choice probability following the end of thirst stimulation in hungry animals. This statistic is not sensitive to the magnitude of thirst added during the stimulation epoch in simulations (since the landscape is assumed to have returned to its previous shape following the end of thirst stimulation) and therefore depends strongly on the diffusion dynamics. j, Probability density of water choices following the termination of optogenetic stimulation. Solid blue line, water choice probability in hungry animals performing Buridan’s assay based on experimental data. Solid black line, median water choice probability across repeated simulated optogenetic stimulation sessions with high hunger and low thirst. Exponential decay functions () fit to the experimental data, red dashed line, or to each simulation of the experimental dataset, light gray lines. Each dataset with 3 sessions and 75 stimulation epochs was simulated 128 times. k, l, Distribution of exponential decay function parameters (scale, k), and (decay, l), fit to the simulated water choice probability data (gray bars) with the parameter values from experimental fits superimposed in red. Scale and decay parameters two-sided fit from experimental data are not significantly different from those fit from simulation, tail statistics P = 0.492 and P = 0.602, respectively. m, n, Additional examples of behavioral simulations from the model as above, except the ratio of the scale parameters on noise and gradient in the model has been skewed too high (m) or too low (n), resulting in disorganized behavior (m) or overly persistent behavior (n).

