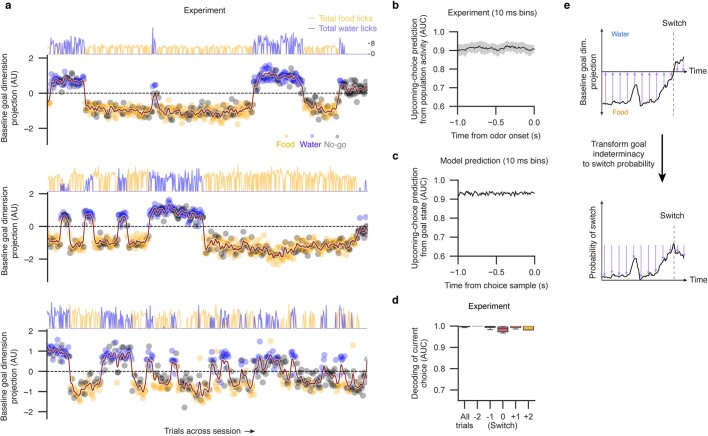
Extended Data Fig. 8. Additional experimental examples on goal activity and decoding analyses.
a, Activity along the goal dimension in simultaneously recorded neural activity for three additional sessions. Measurements (baseline population activities projected onto the goal dimension) are shown per-trial for 0–1 s prior to water choices (blue dots), food choices (orange dots), and No-Go trials (black dots). Projection magnitude shown in arbitrary units (A.U.). Maroon line, projection smoothed by a Butterworth filter for visualization. Left, session start; right, session end. Top, corresponding cumulative licks per trial for food (orange) and water (blue). b, Predictiveness for upcoming choice from population neuronal activity in experiments, fit on a 10-ms resolution. Mean, solid line; ± s.e.m., gray area. n = 7 mice, 7 sessions. c, Model prediction for baseline persistence of population upcoming-choice predictiveness (AUC, receiver operator characteristic area under the curve) on a fast timescale (10 ms bins, Methods). n = 7 simulated sessions. d, Decoding performance (AUC, y-axis) of current reward from average population firing rates 1–2 s post-odor onset surrounding hit trials with behavioral switches (x-axis, trial position relative to switch-trial labeled 0). AUC values for all trials for each trial position relative to switches are averaged within session. n = 7 mice, 7 sessions. Boxplots span lower and upper quartiles of distributions; lines indicate median values; whiskers indicate the range of values within 1.5 times the interquartile range. Firing rates following reward choice remain highly predictive of recent reward identity surrounding behavioral switches. This contrasts with Fig. 4e, in which decoding performance of the upcoming choice from baseline activity is diminished in trials both before, during, and following behavioral switches. e, Schematic illustrating the transformation of population goal activity into a probability of upcoming switch. Top, schematized population activity along the goal dimension (black line) near a switch (dashed vertical line). As observed in Fig. 4e, activity along the goal dimension loses discriminability (AUC towards 0.5) for reward choices near switches. The magnitude of the distance of the goal-activity from the center line (purple arrows) is linearly rescaled into a probability of upcoming switch (bottom). Thus, upcoming switches become more predictable than chance (Fig. 4i) by transforming the degree of indeterminacy of the current population activity (regarding whether the upcoming choice will be food or water) into a probability that a switch will occur.

