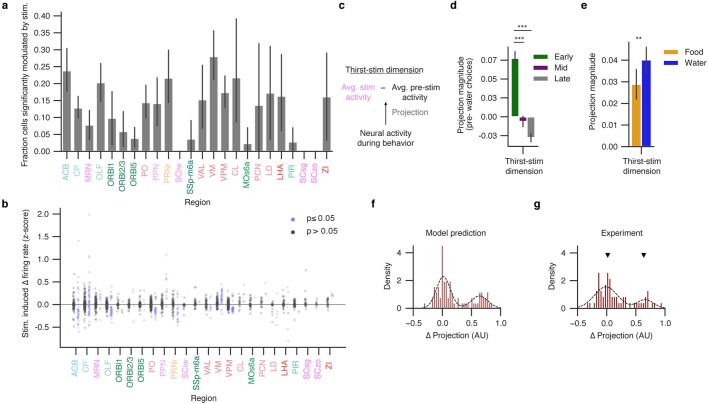
Extended Data Fig. 10. Additional analyses of optogenetic perturbations during recording.
a, b, Modulation of brain regions by optogenetic stimulation of SFO Rxfp1+ osmotic thirst neurons. Neurons were defined as significant if their mean firing rates during optogenetic stimulation were different from their mean firing rates prior to stimulation, two-sided t-test with significance threshold P ≤ 0.05, n = 20 stimulation epochs per cell. a, Fraction of cells within each region that were significantly modulated by thirst stimulation. Mean ± 95% confidence interval. Region labels are color coded by the Allen Brain Atlas colormap. b, Modulation of individual neurons (dots) in each region, neurons color coded by significance of modulation across multiple stimulation epochs. Y-axis, change in firing rates (z-scored across the entire recording session). c, In a complementary analysis of the thirst perturbation prior to Buridan’s assay, shown in Fig. 4l–o, a thirst-stim axis (difference between average activity during and before optogenetic stimulation) is constructed and neural activity from the subsequent behavior period is projected onto it in d and e. d, Projection onto the thirst-stim axis of baseline population activity preceding water choices, for early rewards (first third), middle rewards (middle third), or late rewards (last third) in a session. ***, one-sided t-test; early versus mid, t = 21.47, P = 1.21 × 10−86; early versus late, t = 11.82, P = 3.96 × 10⁻²⁴; n = 674 early trials, 511 mid trials, 103 late trials. Mean ± 95% confidence intervals. e, Projection onto the thirst stim axis of baseline population activity preceding food trials (orange) or water trials (blue). **, one-sided t-test, t = −2.33, P = 0.01; mean ± 95% confidence intervals. In summary (c–e), neural activity characteristic of thirst stimulation correlates with behavioral satiety (d) and increases more before water choices than before food choices (e). f, g, Analysis of the variability in neural responses along the goal dimension upon simulated (f) or experimental (g) optogenetic stimulation epochs, related to Fig. 4n,o. Change in activity along the goal dimension was averaged in the last two seconds of each stimulation epoch across all simulated or experimental sessions. The distribution of these changes in activity were visualized as normalized histograms. f, The statefulness and indirect influence of needs in the model predict a bimodal distribution (dashed lines, two Gaussians fit by a mixture model) of activity changes along the goal dimension, with many simulated stimulation epochs not resulting in significant change along the goal dimension (left Gaussian). g, In line with the model predictions, activity changes along the goal dimension across all experimental epochs (n = 61) also followed a bimodal distribution (dashed lines, Gaussians fit by mixture model to the experimental data) with many optogenetic stimulation epochs yielding no change in goal dimension activity. Arrowheads indicate the mean locations of the Gaussians fit to the simulated data. For both simulated and experimental data, model comparison (Bayes’ Information Criteria, BIC) favored a bimodal distribution over a unimodal distribution (unimodal Gaussian fit to simulated data, BIC = 47.966; bimodal Gaussian mixture fit to simulated data, BIC = 13.223; unimodal Gaussian fit to experimental data, BIC = 48.374; bimodal Gaussian fit to experimental data, BIC = 45.042).

