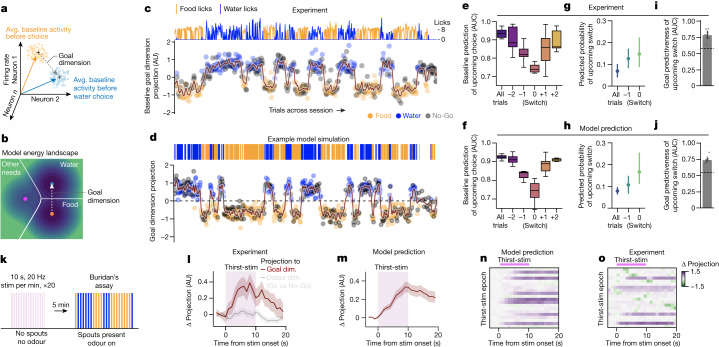
Fig. 4. Model predicts neural state transition dynamics during natural behaviour and optogenetic thirst induction.
a, Population activity of simultaneously recorded neurons evolves in time across an approximately 1,000-dimensional space. The goal dimension is the vector separating the average (avg.) baseline activity in the 1 s before water choices (blue arrow) from that before food choices (orange arrow). b, In the model, neural activity evolves in time in a two-dimensional need subspace. The goal dimension is the vector separating the energy well centre of water (blue dot) from that of food (orange dot). c,d, In both experiment and model, baseline activity dynamics across time can be measured along the goal dimension by linear projection, yielding a per-trial goal dimension activity state for water choices, food choices and No-Go trials in an experimental (c) or a simulated (d) session. The maroon line is a smoothed projection. Top, cumulative licks (c) or reward choices (d) per trial for food and water. AU, arbitrary units. e,f, Experimental results (e; Go trials only: n = 7 mice, 7 sessions) and simulation (f; n = 7 simulated sessions) of population activity predictiveness of upcoming choices surrounding trials with behavioural switches (x axis, trial position relative to switch trial as 0). Box plots delineate lower and upper quartiles; lines indicate median values; and whiskers span the range of values within 1.5 times the interquartile range. g,h, Predicted probability that a switch will occur on the upcoming Go trial for all trials, the Go trial before a switch (–1), or the switch trial (0) in experimental data (g) or simulation (h), using baseline population activity in the goal dimension. i,j, Goal predictiveness of an upcoming switch of the population for each session in experimental data (i) or as predicted by the model (j). Dashed line, null. g–j, Data are mean ± 95% confidence interval; n = 7 mice, 7 sessions. k, Schematic showing 20 epochs of 10-s, 20-Hz optogenetic osmotic thirst stimulation (purple bars) during Neuropixels recording without reward spout or odour. This is followed by Buridan’s assay with spout access and odour presentation. l, Changes in neural activity surrounding stimulation epochs are projected onto the goal dimension or the dimension separating Go versus No-Go-odour activity as a control. Values scaled by the maximum along the given dimension during subsequent behaviour. Positive values on the y axis are aligned with water seeking (goal dimension) and Go odours (odour dimension) during behaviour. n = 2 mice, 3 sessions, 61 stimulation epochs. Projection binned by 1-s intervals. Data are mean ± s.e.m. Dim., dimension. m, Simulation of optogenetic thirst stimulation prior to Buridan’s assay in hungry and thirsty mice. Solid line and lighter area indicate mean ± s.e.m. of change in simulating goal dimension projection over baseline (Δ projection). n = 3 simulations, 75 perturbation epochs. n,o, Goal activity responses to individual stimulation epochs for simulation in m (n) and for the experiment in k (o; n = 20 for each). Magnitudes of activity change along the goal dimension are indicated by colour codes and scaled to the peak modulation.

